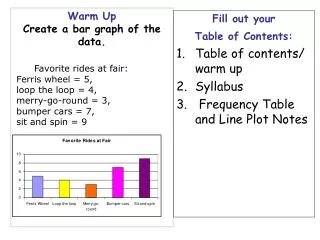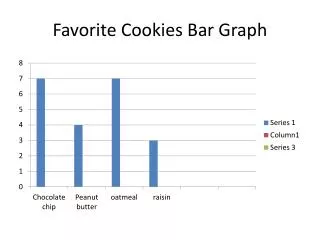
bar graph
bar graph. A graph that compares data by using bars of different lengths and heights. equally likely. Having the same chance of occurring. Example : coin toss you are equally likely to flip a head or tail. line plot.

bar graph
E N D
Presentation Transcript
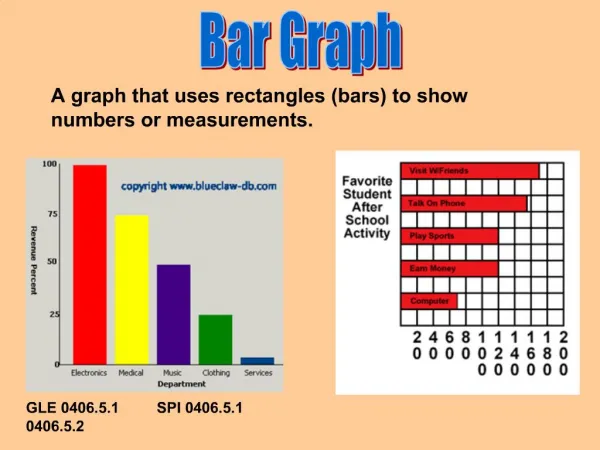
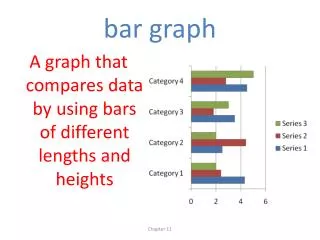
bar graph A graph that compares data by using bars of different lengths and heights Chapter 11
equally likely Having the same chance of occurring. Example: coin toss you are equally likely to flip a head or tail. Chapter 11
line plot a graph that uses columns of Xs above a number line to show frequency of data. Chapter 11
outcomes A possible result of an experiment. Chapter 11
prediction Something you think will happen such as a specific outcome of an experiment. Chapter 11
probability The chance an event will happen. Chapter 11
scale A set of numbers that are equally spaced along a side of a graph. Chapter 11
survey A method of collecting data. Chapter 11
tally chart A way to keep track of data using tally marks to record the results. Chapter 11