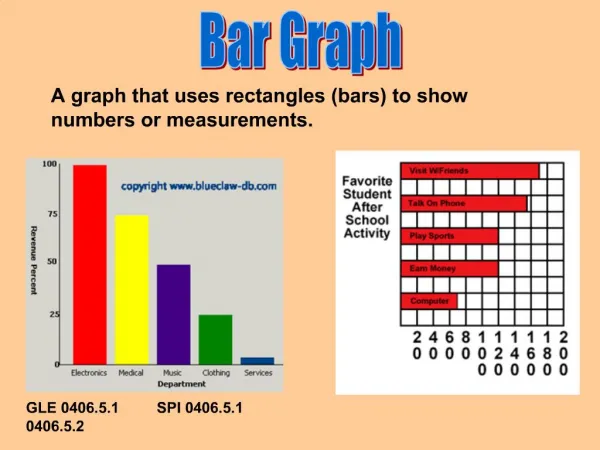
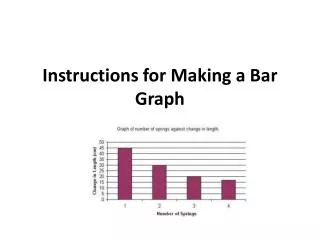
Instructions for Making a Bar Graph
Instructions for Making a Bar Graph. Graphing Data. Students will need to make a bar graph using data provided by the teacher Independent Variable Dependent Variable Title Appropriate numbering system for data

Instructions for Making a Bar Graph
E N D
Presentation Transcript
Graphing Data Students will need to make a bar graph using data provided by the teacher Independent Variable Dependent Variable Title Appropriate numbering system for data Bars: consistent width, consistent spacing, bars are labeled, and the go the correct height
Variable and Titles on Graphs The independent variable should be on the bottom (ie. X-axis) The dependent variable should be on the left side (ie. Y-axis) Don't forget to use the unit (ie. cm, kg, etc.) The title should be on the top and should be independent variable vs. dependent variable
Write the Independent Variable on the Bottom Line of the Graph Paper
Write the Dependent Variable on the Left Side of the Graph Paper (include the units being used)
Write the Title on the Top (steal the variables and write them on the top with vs. in between)
Numbering the Graph Look at the biggest number you will need to graph (example: 96) Round it up to the next reasonable number (example: for 96, think 100) Try to make your graph go to 100 by counting by something like 10. If counting by 10 doesn't work, try a different number.
Numbering the Graph (cont.) Always try to count by numbers which are easy to count by (examples: 1, 2, 5, 10, 20, 25, 50, 100, etc.) When you find numbers which work for your set of data, carefully number the lines.
Number Your Graph • Find the greatest number you will need to graph and circle it on your data table
Number Your Graph • You should have circled 19.
Number Your Graph • Round 19 up (you always must round up for this activity).
Number Your Graph • You should now be thinking about the number 20.
Number Your Graph • Look at the graph paper you have been given and try and figure out what to count by so 20 is at the top of the graph paper (or close to the top).
Number Your Graph • You should have come up with counting by 2
Label the Horizontal Lines of the Graph by Counting by Twos 4 2 0
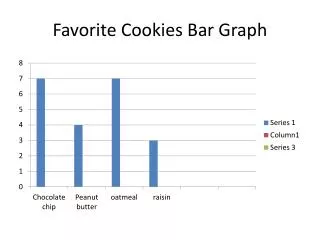
Making the Bars Decide how wide your bars should be based on The graph paper you are given The number of bars you have to graph Make your bars the appropriate height Do not color in your bars Label each of your bars
Make Your Bars • You need to make 3 bars, so figure out a plan which will be consistent and neat
Make Your Bars • Label your bars and have them go to the right height. (do not color in your bars)