Download
1 / 13
130 likes | 183 Vues
Learn how to build a temperature sensing project using a thermistor, voltage divider, and LED bar graph display. Explore the project's parts, how they work, and how to solder. Have fun creating your own temperature display!

E N D
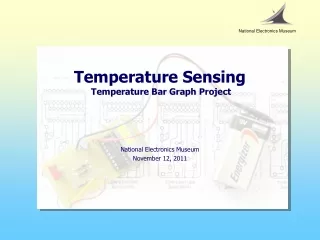
National Electronics Museum Temperature SensingTemperature Bar Graph Project National Electronics Museum November 12, 2011
Temperature Bar Graph Project What you can expect in this segment • What the project it is • What its parts are • How they work • How they go together • Your Project Board • Soldering We’ll Explain
Thermistor Temperature Bar Graph • What is it? An display of bars that indicate temperature at a probe • What are its main parts? Bar Graph Display Temperature probe Voltage Divider How does it work? . . .
10 Volts R1=6 ohms 5V 5V 4V 6V R2=6 ohms 5.0 V 6.0 V 10 Volts R1=4 ohms R2=6 ohms Voltage Divider Series resistors across a voltage make a Voltage Divider • Voltage divides in proportion to the resistance values 6 Ohms/ 12 Ohms X 10V = 5V R2 / (total) 6 Ohms/ 10 Ohms X 10V = 6V R2 / (total) Resistor
Thermistor • Thermistor • A resistor that changes its value with temperature • Thermistor Temperature Coefficient (TC) • TC describes how the resistance changes with temperature • Negative Temp Coefficient (“NTC”) • Resistance decreases with increasing temperature • Temp gets higher - Resistance becomes lower • Temp gets Lower – Resistance becomes higher Let’s use this feature in a Voltage Divider . . .
Thermistor resistance varies with temperature 10 Volts R1=Variable Variable R2=Fixed Thermistor Temperature Measurement Voltage changes with temperature in this divider • Use a Thermistor as a resistor in a Voltage Divider • Then voltage out of divider will vary with temperature So voltage out of divider varies with temperature
Displays Displays come in different “flavors” • Analog Meters – needle and scales • Digital Meters – alpha-numeric • Graphic Displays – images, colors, patterns We’ll use a Bar Graph with Light Emitting Diodes (LEDs) . . .
LED BAR GRAPH LED Bar Graphs turn voltage into lighted bars • Number of Lighted LED varies with voltage input • More voltage lights more LED bars Voltage In LED BARGRAPH and Driver
Voltage In LED BARGRAPH and Driver Temp Sensor with Bargraph Readout Rising bars indicate rising thermistor temperature Combine Voltage Divider with Driver & Bar Graph • Thermistor probe changes the voltage divider • LED Driver & Display changes the voltage into bars Temp Thermistor 9V Battery R1=Variable Bars R2=Fixed
Temp Sensor with Bargraph Readout Schematic diagram shows all the parts Display Divider Divider Voltage
Completed Project Board What YOU will build!
Parts Layout U2 Bargraph Chamfered Corner to Upper Right Battery Clip Red + U1 Driver “Dimple” To Left Capacitor C1 Black Stripe - Thermistor RT Diode D1 Band = Cathode Resistor R4, 2.2K Red-Red_Red Resistor R3, 240K Red-Yel-Yel Resistor R2, 150K Brn_Grn-Yel Resistor R5, 5K Potentiometer Adjust so one or two bars are lighted. Then heat with fingers, etc. Have fun!
A Word about Soldering Electronic parts are connected using solder • Solder bonds metal together • Usually copper wire and copper Pads or terminals • Metal must be hot enough to melt solder to make it “stick” • Always heat the metals and let them melt the solder • Simply melting the solder alone makes a poor “cold joint” Soldering temperatures are over 700 degrees F! • Be Careful • Only touch the soldering iron insulated handle • Never set the iron down anywhere but in its holder • Wires will get hot. Hold them with a tool or not at all.