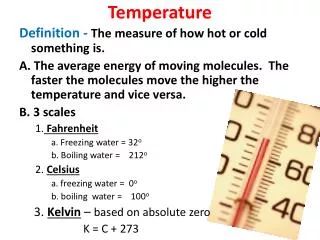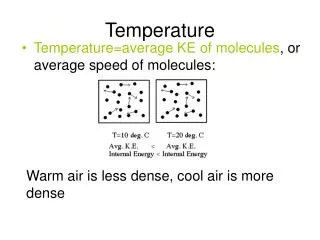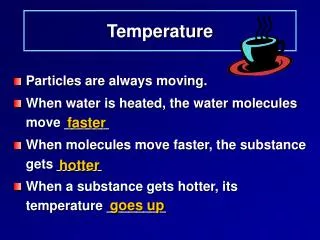
Temperature
Temperature. Profiles/year. Year range: 1864-2005 5%: 1946 50%: 1968 95%: 1994 Total number of NODC profiles: 462,348. Cumulative fraction. Salinity. Profiles/year. Year range: 1912-2004 5%: 1949 50%: 1978 95%: 1997 Total number of NODC profiles: 107,798. Cumulative fraction.

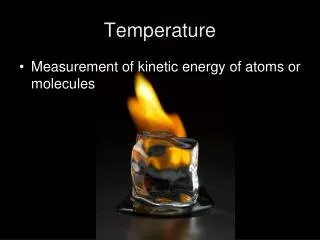
Temperature
E N D
Presentation Transcript
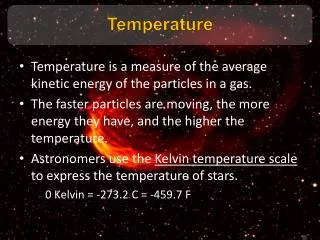
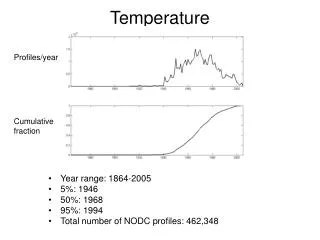
Temperature Profiles/year • Year range: 1864-2005 • 5%: 1946 • 50%: 1968 • 95%: 1994 • Total number of NODC profiles: 462,348 Cumulative fraction
Salinity Profiles/year • Year range: 1912-2004 • 5%: 1949 • 50%: 1978 • 95%: 1997 • Total number of NODC profiles: 107,798 Cumulative fraction
Oxygen Profiles/year • Year range: 1922-2004 • 5%: 1949 • 50%: 1974 • 95%: 1999 • Total number of NODC profiles: 21,467 Cumulative fraction
Temperature (ºC) JAN FEB APR MAR FEB MAY JUN JUL AUG OCT NOV DEC SEP
Salinity JAN FEB APR MAR MAY JUN JUL AUG OCT NOV DEC SEP
Oxygen (mM) JAN FEB APR MAR MAY JUN JUL AUG OCT NOV DEC SEP
pCO2 (matm) JAN FEB APR MAR MAY JUN JUL AUG OCT NOV DEC SEP
March mixed layer depth (m) DT = 0.5 °C DT = 0.8 °C Bottom depth DT = 1.0 °C
September mixed layer depth (m) September DT = 0.5 °C DT = 0.8 °C DT = 1.0 °C Bottom depth
Mixed layer depth (top row: climatology; bottom row nena801) (0.05oC criterion)