Temperature
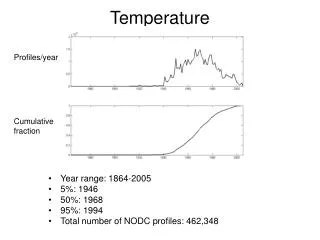
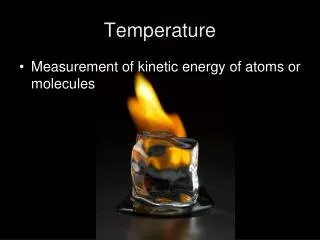
Temperature. Dr. R. B. Schultz. Temperature. Temperature is one of the most basic elements of weather and climate. The daily mean temperature is determined by averaging the 24 hourly readings or by adding the maximum and minimum temperatures for a 24-hour period and dividing by two. .


Temperature
E N D
Presentation Transcript
Temperature Dr. R. B. Schultz
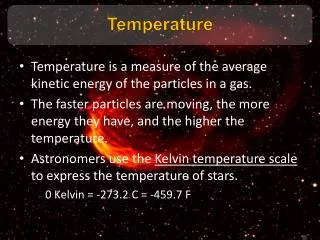
Temperature • Temperature is one of the most basic elements of weather and climate. • The daily mean temperature is determined by averaging the 24 hourly readings or by adding the maximum and minimum temperatures for a 24-hour period and dividing by two.
Daily Temperature • The daily temperature range is computed by finding the difference between the maximum and minimum temperatures. • Other temperature data involving longer periods include the: • monthly mean temperature (the sum of the daily means for each day of the month divided by the number of days in the month), • annual mean temperature (the average of the twelve monthly temperatures), and • annual temperature range (the difference between the warmest and coldest monthly mean temperatures).
Controls of Temperature • The controls of temperature, those factors that cause temperature to vary from place to place, are: • (1) differential heating of land and water, • (2) ocean currents, • (3) altitude, • (4) geographic position, • (5) cloud cover, and • (6) albedo.
Example of Ocean Currents Example of Ocean Currents
Isotherms • On maps illustrating the world distribution of temperature, isotherms, lines that connect points of the same temperature, generally trend east and west and show a decrease in temperature poleward. • Moreover, the isotherms illustrate a latitudinal shifting of temperatures caused by the seasonal migration of the Sun's vertical rays and also reveal the presence of ocean currents. • The north-south migration of isotherms is more pronounced over the continents because the temperatures do not fluctuate as much over water.
Isotherms (cont.) Isothermal Pattern in January
Isotherms (cont.) Isothermal Pattern in July
Isotherms (cont.) Typical Regional Isothermal Map
Temperature Changes • The primary control of daily temperature changes is Earth's rotation. However, the magnitude of these changes is variable and influenced by local factors, local weather conditions, or both. • As a consequence of the mechanism by which Earth's atmosphere is heated, the months of the highest and lowest temperatures do not coincide with the periods of maximum and minimum incoming solar radiation.
Solar Energy Received Although the greatest intensity of solar radiation occurs at the time of the summer solstice, in the Northern Hemisphere the months of July and August are generally the warmest of the year. Conversely, in the Northern Hemisphere a minimum of solar energy is received in December at the time of the winter solstice, but January and February are usually colder.
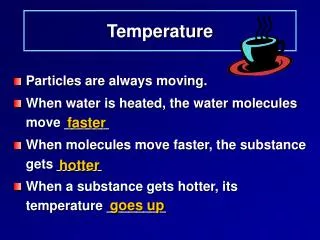
Thermometers • Thermometers measure temperature either mechanically or electrically. • Most mechanical thermometers are based on the ability of a substance to expand when heated or contract when cooled. • One type of mechanical thermometer, the liquid in glass thermometer, includes maximum thermometers, which use the liquid mercury, and minimum thermometers, which contain a liquid of low density, such as alcohol.
Maximum Thermometer Minimum Thermometer
Thermometers (cont.) • A bimetal strip mechanical thermometer is frequently used in a thermograph, an instrument that continuously records temperature. • Electrical thermometers use a thermistor (a thermal resistor) to measure temperature.
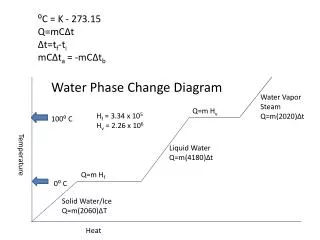
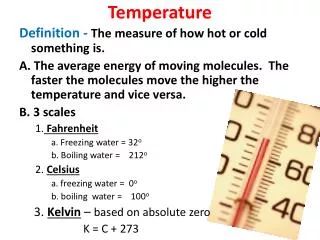
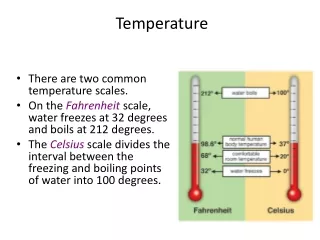
Temperature Scales • Different temperature scales use different reference points, sometimes called fixed points. • The three common temperature scales used to measure temperature are: • (1) the Fahrenheit scale, which is defined by using the ice point (32°) and steam point (212°), • (2) the Celsius scale, a decimal scale on which the melting point of ice is set at 0 and the boiling point of water at 100°, and • (3) the Kelvin or absolute scale, where the zero point represents the temperature at which all molecular motion is presumed to cease (called absolute zero), the ice point is set at 273, and the steam point at 373.
Temperature Indices • Three common applications of temperature indices are: • (1) heating degree days, where each degree of temperature below 65°F is counted as one heating degree day, • (2) cooling degree days, which are determined by subtracting 65°F from the daily mean, and • (3) growing degree days, which are determined from the difference between the daily mean temperature and the base temperature of the crop, the minimum temperature required for it to grow.
Human Perception • One familiar use of temperature data relates to human perception of temperature. • The heat stress index (or heat index), a commonly used expression of summertime discomfort, links humidity and temperature to determine the thermal comfort of the human body. • Wind chill, a typical wintertime index, uses both wind and air temperature to calculate the human sensation of temperature.
Key Terminology Temperature Daily mean temperature Monthly mean temperature Annual mean temperature Annual temperature range Differential heating Isotherms Thermometer Thermograph Fixed points Fahrenheit Scale Celsius Scale Kelvin Scale Heating degree day Cooling degree day Growing degree day Heat index Wind chill