A Quantitative Overview to Gene Expression Profiling in Animal Genetics
110 likes | 281 Vues
A Quantitative Overview to Gene Expression Profiling in Animal Genetics. Analysis of (cDNA) Microarray Data : Part VII. Mixed-Model Equations 2. Armidale Animal Breeding Summer Course, UNE, Feb. 2006. A Quantitative Overview to Gene Expression Profiling in Animal Genetics.

A Quantitative Overview to Gene Expression Profiling in Animal Genetics
E N D
Presentation Transcript
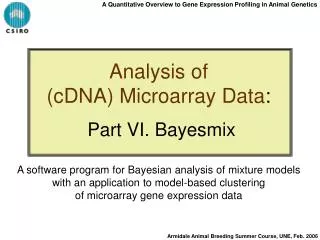
A Quantitative Overview to Gene Expression Profiling in Animal Genetics Analysis of (cDNA) Microarray Data: Part VII. Mixed-Model Equations 2 Armidale Animal Breeding Summer Course, UNE, Feb. 2006
A Quantitative Overview to Gene Expression Profiling in Animal Genetics Mixed-Model Equations Armidale Animal Breeding Summer Course, UNE, Feb. 2006
A Quantitative Overview to Gene Expression Profiling in Animal Genetics Y11 197,802 9.33 1.99 5.17 15.99 768 257.5 139 343 Y12 74,030 10.82 1.91 4.95 15.99 576 128.5 22 243 Y21 110,308 9.99 2.07 4.25 15.99 576 191.5 27 319 Y22 116,409 9.89 2.09 5.17 15.99 576 202.1 19 318 Y23 117,687 10.38 2.04 4.91 15.99 576 204.3 36 320 Y31 106,591 10.11 1.77 6.60 15.99 672 158.6 37 278 Y32 236,671 9.44 2.11 5.36 15.99 1,440 164.3 57 269 Mixed-Model Equations ObservationsComparison Groups Levels Observations N Mean SD Min Max Mean Min Max Armidale Animal Breeding Summer Course, UNE, Feb. 2006
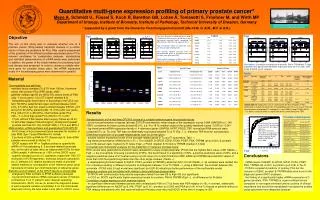
A Quantitative Overview to Gene Expression Profiling in Animal Genetics Mixed-Model Equations Log2 Intensities Residual (RANDOM) Gene x Variety (RANDOM) Comparison Group Array|Block|Dye (FIXED) Main Gene Effect (RANDOM) Gene x Array|Block (RANDOM) DE Genes As opposed to main effects and interactions separately • 54 Array Slides • 959,498 Valid Intensity Records (S2N>1, M2M>0.85) • 7,638 Elements (genes) • 752,476 Equations • 56 (Co)Variance Components (REML) • Mixtures of distributions Armidale Animal Breeding Summer Course, UNE, Feb. 2006
A Quantitative Overview to Gene Expression Profiling in Animal Genetics Mixed-Model Equations 56 (co)variance components Armidale Animal Breeding Summer Course, UNE, Feb. 2006
A Quantitative Overview to Gene Expression Profiling in Animal Genetics Mixed-Model Equations % Total Variance Due to: • Error 3.0 – 3.6 5.1 – 6.7 3.0 – 3.7 • Gene 83.6 – 90.4 78.3 – 81.9 47.5 – 83.9 • Gene x Array 3.5 – 9.8 10.4 – 12.6 10.6 – 43.5 • Gene x Variety 2.4 – 3.7 2.1 – 2.6 2.5 – 5.4 • Genetic Correlations Moderate (EXP3) to Strong • Gene Variety Corr Strong (EXP1) to Moderate (EXP2) Armidale Animal Breeding Summer Course, UNE, Feb. 2006
A Quantitative Overview to Gene Expression Profiling in Animal Genetics Mixed-Model Equations Measures of (Possible) Differential Expression i = 1, …, 7,638 genes j = 1, …, 7 variables t = 0, …, 5 time points (EXP3 only) • Other measure definitions (contrasts) could also be valid Armidale Animal Breeding Summer Course, UNE, Feb. 2006
A Quantitative Overview to Gene Expression Profiling in Animal Genetics Mixed-Model Equations Mixtures of Tri-Variate Normal Distributions Armidale Animal Breeding Summer Course, UNE, Feb. 2006
A Quantitative Overview to Gene Expression Profiling in Animal Genetics Mixed-Model Equations Mixtures of Tri-Variate Normal Distributions Non-DE DE in d1 Up-DE in d2 DE in d3 Down-DE in d2 Armidale Animal Breeding Summer Course, UNE, Feb. 2006
A Quantitative Overview to Gene Expression Profiling in Animal Genetics Mixed-Model Equations Densities and Posterior Probabilities Armidale Animal Breeding Summer Course, UNE, Feb. 2006
A Quantitative Overview to Gene Expression Profiling in Animal Genetics Mixed-Model Equations Differentially Expressed Genes Exp1 Exp2 Exp3 Up Down Up Down Up Down High-Low Up 409 0 26 13 36 11 Down 41 3 0 5 0 HOL-JBL Up 68 0 0 8 Down 319 10 6 TSS-UTS Up 252 0 Down 109 10 DE Elements across the 3 Exp (2 UP/DOWN/UP; 8 UP/UP/DOWN) Armidale Animal Breeding Summer Course, UNE, Feb. 2006