Download
1 / 19
190 likes | 312 Vues
This course overview discusses quantitative methods for gene expression profiling in animal genetics, specifically utilizing mixture of distributions models for clustering analysis. It covers the use of the EM algorithm to obtain maximum likelihood estimates and introduces concepts like the Akaike Information Criterion (AIC) and Bayesian Information Criterion (BIC) for model selection. Practical simulations illustrate the application of these methods, demonstrating how they can differentiate between different gene distributions and the significance of posterior probabilities in false discovery rate analysis.

E N D
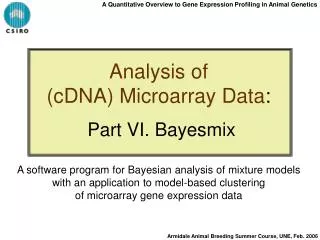
A Quantitative Overview to Gene Expression Profiling in Animal Genetics Analysis of (cDNA) Microarray Data: Part V. Mixtures of Distributions Model-Based Clustering via Mixtures of Distribution Armidale Animal Breeding Summer Course, UNE, Feb. 2006
A Quantitative Overview to Gene Expression Profiling in Animal Genetics Mixtures of Distributions Definition • The mixture model assumes that each cluster (or component) of the data is generated by an underlying normal distribution. • Each of the data in y are assumed to be independent observations from a mixture density with k (possibly unknown but finite) components and with probability density function: Normal density function Mixing proportions (add to 1) Armidale Animal Breeding Summer Course, UNE, Feb. 2006
A Quantitative Overview to Gene Expression Profiling in Animal Genetics Mixtures of Distributions Introduction Armidale Animal Breeding Summer Course, UNE, Feb. 2006
A Quantitative Overview to Gene Expression Profiling in Animal Genetics Mixtures of Distributions http://www.maths.uq.edu.au/~gjm The Guru Armidale Animal Breeding Summer Course, UNE, Feb. 2006
A Quantitative Overview to Gene Expression Profiling in Animal Genetics Mixtures of Distributions Software and Resources Armidale Animal Breeding Summer Course, UNE, Feb. 2006
A Quantitative Overview to Gene Expression Profiling in Animal Genetics Mixtures of Distributions EM Algorithm The EM algorithm obtains the maximum likelihood estimate of by iteration. In the (m+1)th iteration, the estimates of the parameters of interest are updated by: Where Is the Posterior Probability that yj belongs to the i-th component of the mixture (…with a very elegant link to False Discovery Rate). Armidale Animal Breeding Summer Course, UNE, Feb. 2006
A Quantitative Overview to Gene Expression Profiling in Animal Genetics Mixtures of Distributions EM Algorithm • We proceed for k = 1, 2, 3, …, and so on components. • Criteria for model selection includes the Akaike Information Criterion (AIC) and the Bayesian Information Criterion (BIC): Where Is the number of independent parameters in the mixture. • Alternatively, the distribution of the likelihood ratio test (LRT) can be estimated by bootstrapping and P-values obtained to contrast a model with k components against a model with k + 1 components. Armidale Animal Breeding Summer Course, UNE, Feb. 2006
A Quantitative Overview to Gene Expression Profiling in Animal Genetics Mixtures of Distributions Simulation 1 Records 10,000 5,000 Consider these Distribution N(1,5) N(5,10) …and simulate The Mixture becomes: Posterior Prob: Likelihood N(1,5) N(5,10) -1 0.120 0.021 0 0.161 4 0.036 1 0.178 0.056 5 0.036 3 0.126 7 0.005 0.103 6 2 Weighted average (by mixing proportions) Armidale Animal Breeding Summer Course, UNE, Feb. 2006
A Quantitative Overview to Gene Expression Profiling in Animal Genetics Mixtures of Distributions Simulation 2 Records 9,000 1,000 Microarray Non-DE Genes DE Genes Consider these Distribution N(0,1) N(0,10) …and simulate The Mixture becomes: Armidale Animal Breeding Summer Course, UNE, Feb. 2006
A Quantitative Overview to Gene Expression Profiling in Animal Genetics Mixtures of Distributions Simulation 2 1. Simulate: 2. Ask EMMIX to fit mixtures with up to 5 components and… 3. EMMIX model of best fit: Armidale Animal Breeding Summer Course, UNE, Feb. 2006
A Quantitative Overview to Gene Expression Profiling in Animal Genetics Mixtures of Distributions Simulation 2 1. Simulate: 3. EMMIX best fit: Post Prob Frequency Posterior Probabilities are “Decision Function” changing at 2.75 Armidale Animal Breeding Summer Course, UNE, Feb. 2006
A Quantitative Overview to Gene Expression Profiling in Animal Genetics Mixtures of Distributions Linking Posterior Probabilities with False Discovery Rate Armidale Animal Breeding Summer Course, UNE, Feb. 2006
A Quantitative Overview to Gene Expression Profiling in Animal Genetics Mixtures of Distributions Linking Posterior Probabilities with False Discovery Rate Select the N most extreme genes, and FDR is the average posterior probability of not being in the cluster of extremes. DE Not-DE Armidale Animal Breeding Summer Course, UNE, Feb. 2006
A Quantitative Overview to Gene Expression Profiling in Animal Genetics Mixtures of Distributions Simulation 2 1. Simulate: 3. EMMIX best fit: FDR by N Genes Select the N most extreme genes, and FDR is the average Post Prob of not being in the cluster of extremes. Post Prob Armidale Animal Breeding Summer Course, UNE, Feb. 2006
A Quantitative Overview to Gene Expression Profiling in Animal Genetics Mixtures of Distributions Example “Diets” (only REFERENCE components of the design) Armidale Animal Breeding Summer Course, UNE, Feb. 2006
A Quantitative Overview to Gene Expression Profiling in Animal Genetics Mixtures of Distributions Example “Diets” (only REFERENCE components of the design) Armidale Animal Breeding Summer Course, UNE, Feb. 2006
A Quantitative Overview to Gene Expression Profiling in Animal Genetics Mixtures of Distributions Example “Diets” (only REFERENCE components of the design) Armidale Animal Breeding Summer Course, UNE, Feb. 2006
A Quantitative Overview to Gene Expression Profiling in Animal Genetics Mixtures of Distributions “Diets” (only REFERENCE components of the design) Example Armidale Animal Breeding Summer Course, UNE, Feb. 2006
A Quantitative Overview to Gene Expression Profiling in Animal Genetics Mixtures of Distributions “Diets” (only REFERENCE components of the design) Example FDR by N Genes In Reverter et al. ‘03 (JAS 81:1900), 27 genes were reported as having a PP > 0.95 of being in the extreme cluster. Now, we can assess that these 27 genes include a FDR < 10%. Armidale Animal Breeding Summer Course, UNE, Feb. 2006