Assessing gene expression quality in Affymetrix microarrays
680 likes | 939 Vues
Assessing gene expression quality in Affymetrix microarrays. Outline. The Affymetrix platform for gene expression analysis Affymetrix recommended QA procedures The RMA model for probe intensity data Application of the fitted RMA model to quality assessment.

Assessing gene expression quality in Affymetrix microarrays
E N D
Presentation Transcript
Outline • The Affymetrix platform for gene expression analysis • Affymetrix recommended QA procedures • The RMA model for probe intensity data • Application of the fitted RMA model to quality assessment
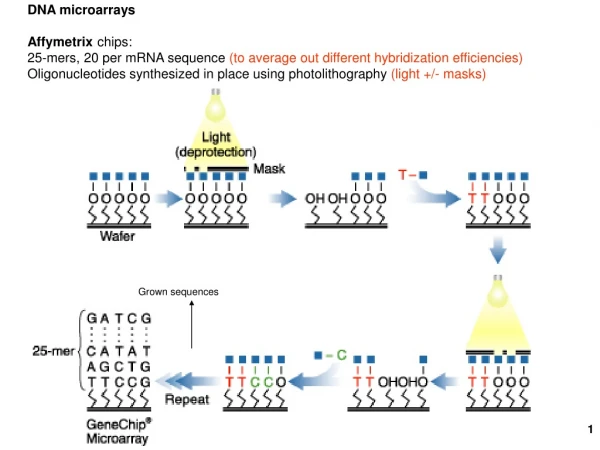
Probe selection Probes are 25-mers selected from a target mRNA sequence. 5-50K target fragments are interrogated by probe sets of 11-20 probes. Affymetrix uses PM and MM probes
* * * * * Oligonucleotide Arrays Hybridized Probe Cell GeneChipProbe Array Single stranded, labeled RNA target Oligonucleotide probe 18µm 106-107 copies of a specific oligonucleotide probe per feature 1.28cm >450,000 different probes Image of Hybridized Probe Array Compliments of D. Gerhold
Obtaining the data • RNA samples are prepared, labeled, hybridized with arrays, arrrays are scanned and the resulting image analyzed to produce an intensity value for each probe cell (>100 processing steps) • Probe cells come in (PM, MM) pairs, 11-20 per probe set representing each target fragment (5-50K) • Of interest is to analyze probe cell intensities to answer questions about the sources of RNA – detection of mRNA, differential expression assessment, gene expression measurement
Pre-hybe RNA quality assessment Look at gel patterns and RNA quantification to determine hybe mix quality. QA at this stage is typically meant to preempt putting poor quality RNA on a chip, but loss of valuable samples may also be an issue.
Post-hybe QA: Visual inspection of image • Biotinylated B2 oligonucleotide hybridization: check that checkerboard, edge and array name cells are all o.k. • Quality of features: discrete squares with pixels of slightly varying intensity • Grid alignment • General inspection: scratches (ignored), bright SAPE residue (masked out)
MAS 5 algorithms • Present calls: from the results of a Wilcoxon’s signed rank test based on: (PMi-MMi)/(PMi+MMi)- for small (~.015). ie. PM-MM > *(PM+MM)? • Signal:
Post-hybe QA: Examination of quality report • Percent present calls : Typical range is 20-50%. Key is consistency. • Scaling factor: Target/(2% trimmed mean of Signal values). No range. Key is consistency. • Background: average of of cell intensities in lowest 2%. No range. Key is consistency. • Raw Q (Noise): Pixel-to-pixel variation among the probe cells used to calculate the background. Between 1.5 and 3.0 is ok.
Examination of spikes and controls • Hybridization controls: bioB, bioC, bioD and cre from E. coli and P1 phage, resp. • Unlabelled poly-A controls: dap, lys, phe, thr, tryp from B. subtilis. Used to monitor wet lab work. • Housekeeping/control genes: GAPDH, Beta-Actin, ISGF-3 (STAT1): 3’ to 5’ signal intensity ratios of control probe sets.
How do we use these indicators for identifying bad chips? We illustrate with 17 chips from a large publicly available data set from St Jude’s Children’s Research Hospital in Memphis, TN.
Hyperdip_chip A - MAS5 QualReport #12 bad in Noise, Background and ScaleFactor #14? #8? C1? C11? C13-15? C16-C4? C8? R4? Only C6 passes all tests. Conclusion?
Limitations of Affymetrix QA/QC procedures • Assessments are based on features of the arrays which are only indirectly related to numbers we care about – the gene expression measures. • The quality of data gauged from spike-ins requiring special processing may not represent the quality of the rest of the data on the chip. We risk QCing the chip QC process itself, but not the gene expression data.
New quality measures Aim: • To use QA/QC measures directly based on expression summaries and that can be used routinely. To answer the question “are chips different in a way that affects expression summaries?” we focus on residuals from fits in probe intensity models.
Summary of Robust Multi-chip Analysis • Uses only PM values • Chips analysed in sets (e.g. an entire experiment) • Background adjustment of PM made • These values are normalized • Normalized bg-adjusted PM values are log2-d • A linear model including probe and chip effects is fitted robustly to probe chip arrays of log2N(PM-bg) values
The probe intensity model On a probe set by probe set basis (fixed k), the log2 of the normalized bg-adjusted probe intensities, denoted by Ykij, are modelled as the sum of a probe effect pki and a chip effect ckj, and an errorkij Ykij = pki + ckj+ kij To make this model identifiable, we constrain the sum of the probe effects to be zero. The pki can be interpreted as probe relative non-specific binding effects. The parameters ckj provide an index of gene expression for each chip.
Least squares vs robust fit Robust procedures perform well under a range of possible models and greatly facilitates the detection of anomalous data points. Why robust? • Image artifacts • Bad probes • Bad chips • Quality assessment
M-estimators(a one slide caption) One can estimate the parameters of the model as solutions to where is a symmetric, positive-definite function that increasing less rapidly than x. One can show that solutions to this minimization problem can be obtained by an IRLS procedure with weights:
Robust fit by IRLS At each iteration rij = Yij - current est(pi)- current est(cj), S = MAD(rij) a robust estimate of the scale parameter uij = rij/S standardized residuals wjj =(|uij|) weights to reduce the effect of discrepant points on the next fit Next step estimates are: est(pi) = weighted row i mean – overall weighted mean est(cj) = weighted column j mean
Example – Huber function Huber function
Picture of the data – k=1,…, K • Robust vs Ls fit: whether ckj is weighted average or not. • Single chip vs multi chip: whether probe effects are removed from residuals or not – has huge impact on weighting and assessment of precision.
Model components – role in QA • Residuals & weights – now >200K per array. • summarize to produce a chip index of quality. • view as chip image, analyse spatial patterns. • scale of residuals for probe set models can be compared between experiments. • Chip effects > 20K per array • can examine distribution of relative expressions across arrays. • Probe effects > 200K per model for hg_u133 • can be compared across fitting sets.
Chip index of relative quality We assess gene expression index variability by it’s unscaled SE: We then normalize by dividing by the median unscaled SE over the chip set (j):
Example – NUSE + residual images • Affymetrix hg-u95A spike-in, 1532 series – next slide. • St-Judes Childern’s Research Hospital- several groups – slides after next. Note – special challenge here is to detect differences in perfectly good chips!!!
St Jude hosptial NUSE + wts images HERE • St-Judes Childern’s Research Hospital- two groups selected from over all fit assessment which follows.
E2A_PBX1 - weights Patterns of weights help characterize the problem
E2A_PBX1 – pos res Residual patterns may give leads to potential problems.
Another quality measure: variability of relative log expression How much are robust summaries affected? We can gauge reproducibility of expression measures by summarizing the distribution of relative log expressions: For reference expression, in the absence of technical replicates, we use the median expression value for that gene in a set of chips.
Relative expression summaries • IQR(LRkj) measures variability which includes Noise + Differential expression in biological replicates. • When biological replicates are similar (eg. RNA from same tissue type), we can typically detect processing effects with IQR(LR) • Median(LRkj) should be close to zero if No. up and regulated genes are roughly equal. IQR(LRkj)+|Median(LRkj)| can be combined to give a measure of chip expression measurement error.
Other Chip features: Signal + Noise We consider the Noise + Signal model: PM = N + S Where N ~ N(, 2) and S ~ Exp(1/) We can use this model to obtain “background corrected” PM values – won’t discuss here. Our interest here is to see how measures of level of signal (1/) and noise () relate to other indicators. * In the example data sets used here, %P, SF and RMA S/N measures correlate similarly with median NUSE *
Affy hg_u95 spike-in - pairs plots – scratch that! Affymetrix HG_U95 Spike-in Experiment - not much variability to explain!
StJudes U133 A St Judes Hospital All U133A experiments – YMMV
StJudes U133 B St Judes Hospital All U133B experiments – YMMV
Correlation among measures for U133A chips Your Mileage May Vary – ie. depending on chip selection, relationships may differ in your chip set