Download
1 / 56
560 likes | 581 Vues
This study re-analyzes the intensity and other factors of Hurricane Andrew, providing new insights based on satellite imagery, aircraft reconnaissance, and damage surveys. The results suggest that Andrew's intensity at landfall was likely in the range of 136 to 155 kt (Category 5).

E N D
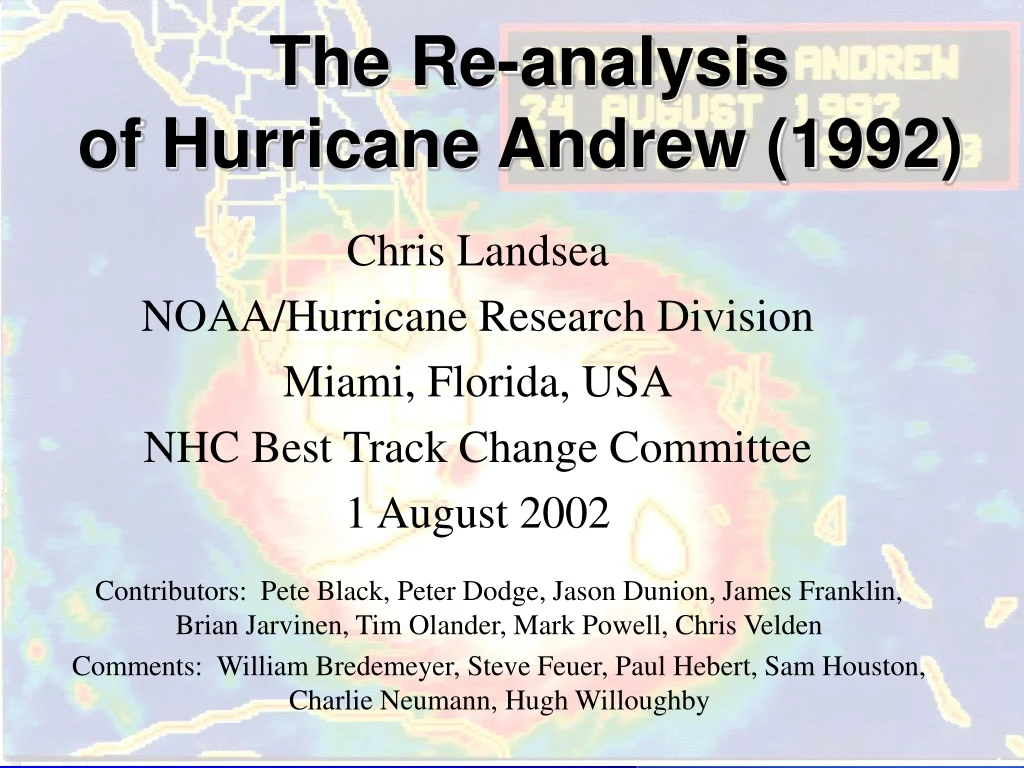
The Re-analysis of Hurricane Andrew (1992) Chris Landsea NOAA/Hurricane Research Division Miami, Florida, USA NHC Best Track Change Committee 1 August 2002 Contributors: Pete Black, Peter Dodge, Jason Dunion, James Franklin, Brian Jarvinen, Tim Olander, Mark Powell, Chris Velden Comments: William Bredemeyer, Steve Feuer, Paul Hebert, Sam Houston, Charlie Neumann, Hugh Willoughby
The Re-analysis of Hurricane Andrew (1992) • Why re-analyze the Atlantic hurricanes and Andrew? • Summary of changes suggested • Flight-level wind to surface extrapolation • Feature tracking from the Miami radar • Pressure-wind relationships • Satellite intensity estimates • Storm surge and SLOSH implications • Estimates of intensity from damage surveys • Discussion of uncertainties
Work of Jose Partagas: Historical Reconstruction from 1851-1910
WHAT IS THE INTENSITY OF A TROPICAL CYCLONE? • Maximum sustained surface wind: Maximum wind, averaged over 1 minute interval at an altitude of 33 ft (10 m), associated with the circulation of the tropical cyclone at a given point in time. • With very, very few exceptions, direct observations of the maximum sustained surface wind in a tropical cyclone are not available.
HOW DO WE ESTIMATE INTENSITY? • Satellite imagery using the Dvorak technique. • Aircraft reconnaissance flight-level winds • GPS dropwindsondes
Revised Best Track
Best Track Winds Best Track Pressures
Revised HURDAT File
In the early 1990’s, reduction factors used by NHC ranged from 75%-90% of the flight-level wind. Powell and Black (1990) concluded 63-73% for 700mb to surface reduction factor, but had few eyewall high-wind cases.
EYEWALL SCHEMATIC EYEWALL EYE AIRCRAFTTRACK DROPSONDE TRAJECTORY 80 70 100 90 10000 ft ~1-2 miles
AVERAGE OF 357 GPS DROPSONDE PROFILES IN THE HURRICANE EYEWALL. ON AVERAGE, THE SURFACE WIND IS 90% OF THE WIND AT 700 MB AIRCRAFT RECONNAISSANCE LEVELS (75-80% AT LOWER ALTITUDES). Franklin et al. (2002)
EYEWALL STRUCTURE CAN VARY SIGNIFICANTLY FROM STORM TO STORM, OR EVEN DURING DIFFERENT STAGES OF THE LIFE CYCLE OF A SINGLE STORM. Franklin et al. (2002)
IMPLICATIONS FOR ANDREW Aircraft measured wind of 162 kt at 10,000 ft at 4:10 am, ~1 hr prior to landfall. If Andrew were occurring today, NHC would estimate a surface sustained wind of ~145 kt (~165 mph), based on taking 90% of the recon wind speed. Franklin, Pers. Comm. Implications for Andrew Franklin et al. (2001)
Step 1: Flight Level to a Mean Boundary Layer (0 to 500m) MBL to 700mb Ratio Distance as a Function of RMW Dunion, Landsea, Houston (2002); Dunion and Powell (2002)
Surface Wind Speed / MBL Wind Speed MBL Wind Speed (ms-1) MBL Wind Speed (mph) Step 2: Mean Boundary Layer (0 to 500m) to the Surface Dunion, Landsea, Houston (2002); Dunion and Powell (2002)
New H*WIND Analysis For Hurricane Andrew 150 kt – 93% of flight level
Some New Hurricane Andrew Data: Radar Feature Tracking
Comparison of Flight Level Data (in Red) To Radar Feature Data (in Green)
Pressure- Wind Relationships: Where Does Andrew Fall? Brown and Franklin (2002)
Large versus Small Hurricanes: Implication for Pressure-Wind Relationship
Hurricane Andrew - Satellite Dvorak Estimates 127 kt/935 mb
Objective Dvorak Technique
Hurricane Andrew’s Storm Surge And SLOSH Runs
Structural Damage Surveys of Hurricane Andrew
Two Main Structural Damage Swaths: Naranja Lakes and Cutler Ridge/Tamiami Fujita (1992); Wakimoto and Black (1994)
Two Main Structural Damage Swaths: Naranja Lakes and Cutler Ridge/Tamiami Fujita (1992); Wakimoto and Black (1994)
The Re-analysis of Hurricane Andrew (1992) • Flight-level wind to surface extrapolation 145 kt (+10) • Feature tracking from the Miami radar 145 kt (+15) • Pressure-wind relationships 145 kt (+20) • Satellite intensity estimates 145 kt (+20) • Storm surge and SLOSH implications 145 kt (+25) • Structural damage survey estimates 135 kt (+30)
CONCLUSIONS * Andrew’s intensity at landfall (and elsewhere) will never be known with certainty. *Andrew’s intensity at landfall is VERY LIKELY to be in the range of 136 to 155 kt (Category 5) for the maximum sustained surface winds in South Florida. *The single best estimate of intensity at landfall is 145 kt. * It is quite UNLIKELY that Andrew was a 125 kt (Category 4) as originally thought.
Atlantic Hurricane Re-Analysis Project http://www.aoml.noaa.gov/hrd/hurdat/index.html • Documentation • Data By Year and Storm • Reference Picture from: "Florida's Hurricane History", by Jay Barnes
GPS DROPWINDSONDE • Developed in conjunction with the NOAA Gulfstream-IV jet aircraft. First systematic use for intensity was in 1998’s Hurricane Bonnie. • GPS dropsondes provide, for the first time, direct measurements of the winds at low levels in the hurricane eyewall. • Dropsonde data reveal that the structure of the eyewall is very complex, and can vary tremendously from storm to storm.
Observational Platforms for Atlantic Hurricanes Neumann et al. (1999)
Incorrect Intensity And Location At Landfall
Too Rapid During Last 6 Hours
Pressure-Wind Relationship
Atlantic Major Hurricanes Bias-removed Landsea (1993)
HOW CAN WE USE THE DROPSONDE DATA TO IMPROVE OUR OPERATIONAL INTENSITY ESTIMATES? DIRECT MEASURMENTS OF SURFACE WINDS INTERPRETATION OF FLIGHT-LEVEL WINDS