Download
1 / 1
10 likes | 122 Vues
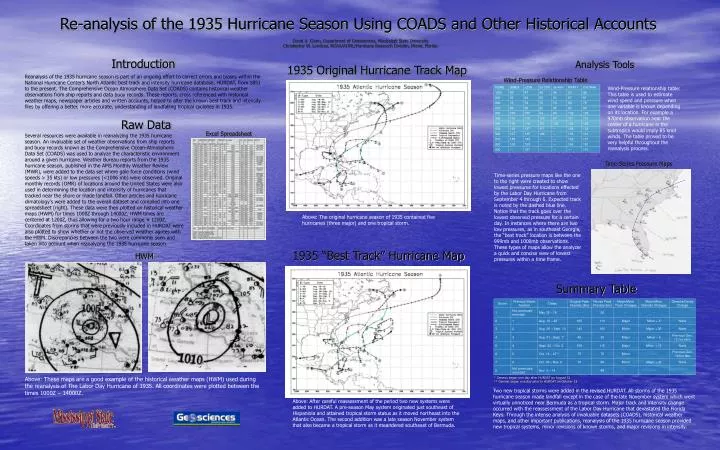
Re-analysis of the 1935 Hurricane Season Using COADS and Other Historical Accounts. David A. Glenn, Department of Geosciences, Mississippi State University Christopher W. Landsea, NOAA/AOML/Hurricane Research Division, Miami, Florida. Introduction. Analysis Tools.

E N D
Re-analysis of the 1935 Hurricane Season Using COADS and Other Historical Accounts David A. Glenn, Department of Geosciences, Mississippi State University Christopher W. Landsea, NOAA/AOML/Hurricane Research Division, Miami, Florida Introduction Analysis Tools 1935 Original Hurricane Track Map Reanalysis of the 1935 hurricane season is part of an ongoing effort to correct errors and biases within the National Hurricane Center’s North Atlantic best track and intensity hurricane database, HURDAT, from 1851 to the present. The Comprehensive Ocean Atmosphere Data Set (COADS) contains historical weather observations from ship reports and data buoy records. These reports, cross referenced with historical weather maps, newspaper articles and written accounts, helped to alter the known best track and intensity files by offering a better, more accurate, understanding of landfalling tropical cyclones in 1935. Wind-Pressure Relationship Table Wind-Pressure relationship table: This table is used to estimate wind speed and pressure when one variable is known depending on its location. For example a 970mb observation near the center of a hurricane in the subtropics would imply 85 knot winds. The table proved to be very helpful throughout the reanalysis process. Raw Data Excel Spreadsheet Several resources were available in reanalyzing the 1935 hurricane season. An invaluable set of weather observations from ship reports and buoy records known as the Comprehensive Ocean-Atmospheric Data Set (COADS) was used to analyze the characteristic environment around a given hurricane. Weather Bureau reports from the 1935 hurricane season, published in the AMS Monthly Weather Review (MWR), were added to the data set where gale force conditions (wind speeds > 35 kts) or low pressures (<1006 mb) were observed. Original monthly records (OMR) of locations around the United States were also used in determining the location and intensity of hurricanes that tracked near the shore or made landfall. Other articles and hurricane climatology's were added to the overall dataset and compiled into one spreadsheet (right). These data were then plotted on historical weather maps (HWM) for times 1000Z through 14000Z. HWM times are centered at 1200Z, thus allowing for a two hour range ±1200Z. Coordinates from storms that were previously included in HURDAT were also plotted to show whether or not the observed weather agrees with the HWM. Discrepancies between the two were commonly seen and taken into account when reanalyzing the 1935 hurricane season. Time-Series Pressure Maps Time-series pressure maps like the one to the right were created to show lowest pressures for locations effected by the Labor Day Hurricane from September 4 through 6. Expected track is noted by the dashed blue line. Notice that the track goes over the lowest observed pressure for a certain day. In instances where there are two low pressures, as in southeast Georgia, the “best track” location is between the 999mb and 1000mb observations. These types of maps allow the analyzer a quick and concise view of lowest pressures within a time frame. Above: The original hurricane season of 1935 contained five hurricanes (three major) and one tropical storm. 1935 “Best Track” Hurricane Map HWM Summary Table Above: These maps are a good example of the historical weather maps (HWM) used during the reanalysis of The Labor Day Hurricane of 1935. All coordinates were plotted between the times 1000Z – 14000Z. * Genesis began one day after HURDAT on August 31 ** Genesis began one day prior to HURDAT on October 18 Two new tropical storms were added in the revised HURDAT. All storms of the 1935 hurricane season made landfall except in the case of the late November system which went virtually unnoticed near Bermuda as a tropical storm. Major track and intensity change occurred with the reassessment of the Labor Day Hurricane that devastated the Florida Keys. Through the intense analysis of invaluable datasets (COADS),historical weather maps, and other important publications, reanalysis of the 1935 hurricane season provided new tropical systems, minor revisions of known storms, and major revisions in intensity. Above: After careful reassessment of the period two new systems were added to HURDAT. A pre-season May system originated just southeast of Hispaniola and attained tropical storm status as it moved northeast into the Atlantic Ocean. The second addition was a late season November system that also became a tropical storm as it meandered southeast of Bermuda.