Interpreting Motion: Understanding Acceleration vs. Time Graphs
Learn how to interpret acceleration vs. time graphs to determine acceleration rate, direction, and objects speeding up or slowing down. Includes explanations on velocity and acceleration directions.

Interpreting Motion: Understanding Acceleration vs. Time Graphs
E N D
Presentation Transcript
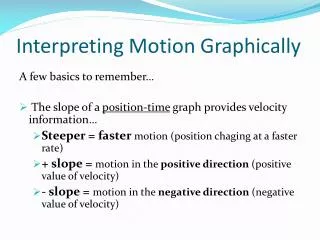
Interpreting Motion How to read an Acceleration vs. Time graph
Acceleration vs. time a (m/s/s) Shows the rate of acceleration and direction (+ or -) which is determined from the slope on the v vs t graph +a t (s) -a We can’t tell if the object is speeding up or slowing down without having the corresponding v vs t graph or d vs t.
Speeding up v Is the velocity in the positive or negative direction? +v +a Is the acceleration positive or negative? t 0 -a -v Velocity and acceleration are in the same direction so both objects are speeding up!
Slowingdown (deceleration) v Is the velocity in the positive or negative direction? +v -a Is the acceleration positive or negative? t 0 -v +a Velocity and acceleration are in opposite directions so both objects are slowing down!
Speeding Up or Slowing Down? Is the velocity positive or negative? +v v Is the acceleration positive or negative? -a t -v Is the velocity positive or negative? -a Is the acceleration positive or negative? Top portion shows slowing down. Bottom portion shows speeding up in opposite direction.
Stationary v a d t t t
Constant velocity v a d t t t
Accelerating v a d t t t