Linear Motion I
Linear Motion I. Distance, Displacement, Average Speed, Average Velocity, Constant Speed, & Position vs. Time Graphs. Vector and Scalar Quantities. Scalar Quantities include magnitude only Example: 50 km Vector Quantities include magnitude & direction Example: -50 km or 50 km West.

Linear Motion I
E N D
Presentation Transcript
Linear Motion I Distance, Displacement, Average Speed, Average Velocity, Constant Speed, & Position vs. Time Graphs
Vector and Scalar Quantities • Scalar Quantities include magnitude only • Example: 50 km • Vector Quantities include magnitude & direction • Example: -50 km or 50 km West
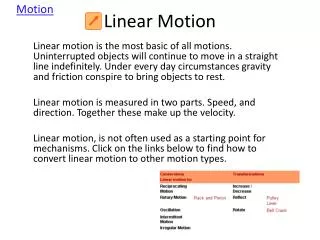
Distance and Displacement • Distance is a scalar quantity. Distance is how far in total an object travels, usually denoted by d. • Displacement is a vector quantity usually denoted by x, sometimes just x. Displacement is the change in position: x = x2 – x1.
Example • A policeman drives 60 miles due East, then 40 miles due West. • What is his distance traveled? • What is his displacement?
Average Speed and Average Velocity • Average speed is a scalar quantity. It describes how fast (the rate) a particle is moving. It is calculated by: • Average velocity is a vector quantity. It describes how fast (the rate) the displacement is changing with respect to time:
B A Dx Dt Average Velocity from a Graph x t
A x B Dx Dt t Average Velocity from a Graph
x(m) 3 2 1 0 A -1 B -2 -3 0 0.1 0.2 0.3 0.4 0.5 t(s) • Sample problem: From the graph, determine the average velocity for the particle as it moves from point A to point B.
x(m) 3 2 1 0 A -1 B -2 -3 0 0.1 0.2 0.3 0.4 0.5 t(s) • Sample problem: From the graph, determine the average speed for the particle as it moves from point A to point B.
Constant Speed Problems • s = d/t • Example: Bob stands at the rim of the Grand Canyon and yodels down to the bottom. He hears his echo back from the canyon floor 5.2 seconds later. Assume that the speed of sound in air is 340 m/s. How deep is the canyon at this location?
Average Speed vs. Velocity Problems • Example: The black mamba is one of the world’s most poisonous snakes, and with a maximum speed of 18.0 km/hr, it is also the fastest. Suppose a mamba waiting in a hide-out sees prey and begins slithering toward it at its maximum speed. After 2.50 s, the mamba realizes its prey can move faster than it can. The snake then turns around and slowly returns to its hide-out in 12.0 s. Calculate a) the mamba’s average speed and b) the mamba’s average velocity
Linear Motion II Instantaneous Speed, Velocity, and Acceleration
x t Average Velocity from a Graph A B Remember that the average velocity between the time at A and the time at B is the slope of the connecting line.
x t Average Velocity from a Graph A B What happens if A and B become closer to each other?
x t Average Velocity from a Graph A B What happens if A and B become closer to each other?
x t Average Velocity from a Graph B A What happens if A and B become closer to each other?
x t Average Velocity from a Graph B A What happens if A and B become closer to each other?
x t Average Velocity from a Graph A and B are effectively the same point. The time difference is effectively zero. B A The line “connecting” A and B is a tangent line to the curve. The velocity at that instant of time is represented by the slope of this tangentline.
x(m) 3 2 1 0 A -1 B -2 -3 0 0.1 0.2 0.3 0.4 0.5 t(s) • Sample problem: From the graph, determine the instantaneous speed and instantaneous velocity for the particle at point B.
Position vs. Time Graphs • What can you conclude about the object’s motion from 0-3 seconds? Notice that the tangent line at every instant during this interval is the same. • What is the object’s velocity from 0-3 seconds?
Position vs. Time Graphs • What is the object’s velocity from 7-8 seconds? • What can you conclude about the object’s motion from 7-8 seconds?
Position vs. Time Graphs • What is the object’s velocity from 8-10 seconds? • What can you conclude about the object’s motion from 8-10 seconds?
Position vs. Time Graphs • It is very important that you are able to look at a graph and explain the object’s motion in detail. • What can you conclude about the object’s motion from 0-9 seconds? (Look at what the slope does) • What can you conclude about the object’s motion from 9-11 seconds?
Position vs. Time Graphs • What can you conclude about the object’s motion from 11-15 seconds? • What can you conclude about the object’s motion from 15-18 seconds?