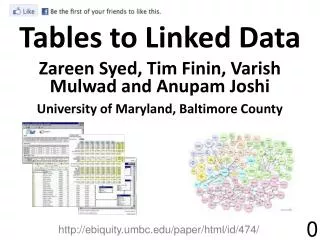
Using Tables TO Organize and Interpret Data
Using Tables TO Organize and Interpret Data. Important Terms to Remember. Data table – a way to format and organize data into rows and columns Raw data – information or data gathered during an experiment before it has been analyzed Optimum – the best Scientific Validity –meaningful .

Using Tables TO Organize and Interpret Data
E N D
Presentation Transcript
Important Terms to Remember • Data table – a way to format and organize data into rows and columns • Raw data – information or data gathered during an experiment before it has been analyzed • Optimum – the best • Scientific Validity –meaningful
Scientific Validity Factors that can make an experiment less valid * equipment that is not calibrated • Using only one member in the control and experimental groups • Failing to have a control group • Not controlling factors in the experiment • Making assumptions without sufficient data • Failing to recognize alterative explanations • Being unable to repeat the experiment
Identifying Validity • In a science experiment, Patrick tests the effect of music on earthworms. • Patrick concluded that classical music is deadly to earthworms but rap music causes them to grow.
Is Patrick’s experiment Valid? • NO!!! • Find the problems – (at least 3 problems) A. B. C.
Identify the following statements as More Valid or Less Valid(be able to explain why you selected your answer) • Natalie wants to test how diet affects the ability of mice to run a maze course. She wants to include five mice per group. However, she can only afford to buy one mouse per group. • Karen performs an experiment, and her results indicate that mice learn more quickly when supplemented with the nutrient choline. Her teacher repeats her experiment and gets similar data.
More Valid or Less Valid / Why? • Micah would like to determine the optimum amount of water that should be given to beefmaster tomato plants for best tomato yield. He divides beefmaster tomato plants into four groups having four plants each. Each group gets a different amount of water and fertilizer.
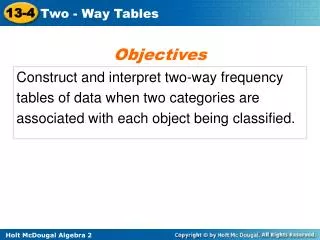
Types of Graphs and When To Use • Line – shows data collected over time • Bar – shows data collected among groups • Pie – shows data in percentage
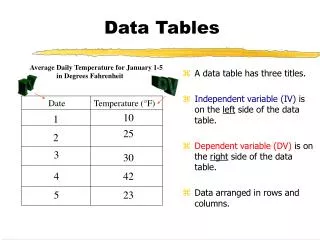
Line Graphs • Must have tails – • T = title • A = axis • Y axis is always for dependent variable • X axis is always for independent variable • I = Interval • L = Labels • S = scale
How to set up your graph! Y Axis (This is for your dependent variable)
How to set up your graph! X Axis (This is for your independent variable)
TAILS Teachers’s Favorite Singer T - Title
TAILS Teachers’s Favorite Singer T - Title A - Axis Y Axis = Dependent Variable X Axis = Independent Variable
TAILS Teachers’s Favorite Singer Decide on an appropriate scale for each axis. Choose a scale that lets you make the graph as large as possible for your paper and data T - Title A – Axis S – Scale
Favorite Singer Number of Teachers Toby Keith 22 Madonna 15 Elvis 11 Sting 5 Sinatra 2 How to determine scale • Scale is determined by your highest & lowest number. • In this case your scale would be from 2 – 22.
Favorite Singer Number of Teachers Toby Keith 22 Madonna 15 Elvis 11 Sting 5 Sinatra 2 How to determine Intervals • The interval is decided by your scale. • In this case your scale would be from 2 – 22 and you want the scale to fit the graph. • The best interval would be to go by 5’s.
TAILS Teachers’s Favorite Singer The amount of space between one number and the next or one type of data and the next on the graph. The interval is just as important as the scale Choose an interval that lets you make the graph as large as possible for your paper and data T – Title A – Axis I – Interval S – Scale
TAILS Teachers’s Favorite Singer T – Title A – Axis I – Interval S – Scale 25 20 15 10 5 0
LABEL your bars or data points TAILS Teachers’s Favorite Singer T – Title A – Axis I – Interval L – Labels S – Scale 25 20 15 Number of Teachers 10 5 0 Toby Keith Madonna Elvis Sting Sinatra Singers
Video On Graphing http://www.youtube.com/watch?v=9BkbYeTC6Mo