Download
1 / 10
100 likes | 302 Vues
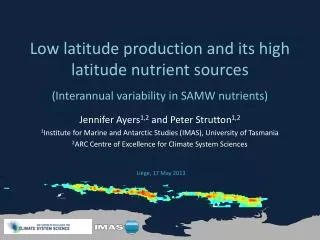
Low latitude production and its high latitude nutrient sources. (Interannual variability in SAMW nutrients). Jennifer Ayers 1,2 and Peter Strutton 1,2 1 Institute for Marine and Antarctic Studies (IMAS), University of Tasmania 2 ARC Centre of Excellence for Climate System Sciences.

E N D
Low latitude production and its high latitude nutrient sources (Interannual variability in SAMW nutrients) Jennifer Ayers1,2 and Peter Strutton1,2 1Institute for Marine and Antarctic Studies (IMAS), University of Tasmania 2ARC Centre of Excellence for Climate System Sciences Liège, 17 May 2013
Low latitude production: fueled by Subantarctic Mode Water (SAMW) nutrients • SAMWs primary source of nutrients to the global thermocline [Sarmiento et al., 2004] • 33-75% of tropical export production supported by SAMW nutrients [Palter et al. 2010] , SAMW Image: dimes.ucsd.edu • Research questions: • Variability in SAMW nutrients? • Forcing? • Implications for downstream productivity Fraction of thermocline nutrients from preformed SAMW pool Palter et al., Biogeosci. 2010
Observed nutrient variability range/mean = % Pacific: 3.1/21.5 = 14% SR03+P11A: 2.6/16.1 = 16% range/mean = % Pacific: 4.4/8.7 = 50% SR03+P11A: 1.3/4.8 = 27% range/mean = % Pacific: 0.25/1.5 = 16% SR03+P11A: 0.27/1.1 = 25% range mean Pacific: 2.0°C 6.5°C SR03+P11A: 0.6°C 8.7°C Pacific sector Australian sector Indian sector
SAM, MOC as drivers of variability Mean MOC ΔMOC, +SAM ΔNutrients, +SAM MLD Motivated by Sarmiento et al. (2004) and Lovenduskiand Gruber (2005) • Other potential drivers of variability not considered: • Variation in max winter mixed layer depth (vertical entrainment) • Upstream lateral induction
Pacific sector SAMW nutrient response to MOC ΔSAMW nutrients (%) per 1 std. dev. change in -WSC ΔSAMW temp (°C) per 1 std. dev. change in -WSC 0.41 < R2 < 0.59 Increased upwelling Increased SAMW nuts (t=1yr) Increased upwelling Increased SAMW nuts (t<1yr) Increased downwelling Increased SAMW nuts (t<<1yr) * Correlations significant at p < 0.05. * indicates significance only at p < 0.10. * * Climatological Ekman transport time: 1.2 yrs • Support for: • Increase in SAMW nutrients with increase in Meridional Overturning Circulation (MOC) • Decreasing lag times with increasing proximity to formation region • Insufficient biological response to consume extra nutrients • Greater change in SAMW Si relative to N &P * Ayers and Strutton (2013, submitted)
Australian sector SAMW nutrient response to ENSO El Niño stronger EAC decreased SAMW nutrients Lag time: 1 year 0.34 < R2 < 0.56 Correlations significant at p < 0.05. El Niño (+MEI Index) associated with decreased SAMW nutrients Ayers and Strutton (2013, submitted) Ridgway and Hill, 2009
Why the greatest change in Si? Mean conditions • 1 stdevΔWSC: • ΔSi:15% • ΔN,P: 5% Biological Nutrient Uptake Fe-limited conditions: Si:N uptake is ~5:1* Fe-limitation eases a little … nutrient replete conditions (which they still aren’t) Si:N uptake ~1:1* Nutrient export in SAMWs High N, P, Low Si N, P + 5%, Si + 15% Nutrient Supply (Fe + macronutrients) When the MOC increases, nutrient supply increases Diatoms could decouple Si from N and P *Brzezinski, 1985 & 2003
Impact on low latitude productivity Dunne et. al, 2007 Global Export Production ~10±3 PgC/yr Tropical Export Production is about 1/3 of that ~3.3±1 PgC/yr 1 stdev change in WSC Δ Tropical export fueled by SAMW nuts N,P: Δ(55 - 250) TgC/yr Si: Δ(165– 375) TgC/yr 33-75% of tropical export fueled by SAMW nuts [Palter et al., 2010] ~1.1-2.5 PgC/yr ΔSAMW nutrient concentrations: ~5-10% N,P ~15% Si ≈ Global C emissions [CDIAC] 2.58 PgC in 2011 > Equatorial Pacific export production (15°N-15°S) 1.09 PgC/yr ≈ 6-13% of mean tropical C export ≈ 1/2 China’s C emissions (1/2)x 677TgC in 2011 Dunne et. al, 2007
In sum: 40-60% of Pacific Sector variability driven by strength of MOC Significant interannual variability in SAMW nutrients(16-50% of the mean) Australian Sector variability correlated with ENSO, attributed to its impact on East Australian Current Consequences for low-latitude productivity (1 std. dev. ΔWSC impacts annual tropical C export by 6-13%) Ayers and Strutton (2013, submitted)