Renewable Portfolio Optimization Tool for Cost-Effective Energy Supply Solutions
60 likes | 158 Vues
Explore the latest version 2.1 of LBNL’s WREZ Model Extension, calculating the cost-effective power delivery to zones through diversified renewable portfolios for achieving targeted renewable penetration levels. The tool aids in peer analysis, deriving supply curves to optimize renewable resources across load zones. Wind and solar dominate the incremental portfolio, tailored to meet regional demands in Southwest and Northwest regions. Access the tool for geospecific renewable sources in Salt Lake City, San Francisco, Sacramento, and Denver.

Renewable Portfolio Optimization Tool for Cost-Effective Energy Supply Solutions
E N D
Presentation Transcript
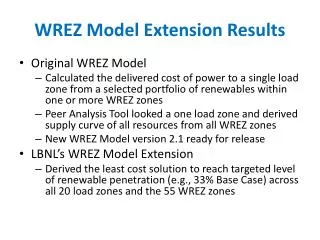
WREZ Model Extension Results • Original WREZ Model • Calculated the delivered cost of power to a single load zone from a selected portfolio of renewables within one or more WREZ zones • Peer Analysis Tool looked a one load zone and derived supply curve of all resources from all WREZ zones • New WREZ Model version 2.1 ready for release • LBNL’s WREZ Model Extension • Derived the least cost solution to reach targeted level of renewable penetration (e.g., 33% Base Case) across all 20 load zones and the 55 WREZ zones
33% Base Case • Wind • 49% of the incremental renewable portfolio • 9 of the 20 load zones 100% wind (NW, Rocky Mtn) • Solar (thermal, wet cooled, 6 hr storage) • 29% of the incremental renewable portfolio • Significant in Southwest (Incremental demand in AZ 100%, NV 66%, and CA 56%) • Other • 10% geothermal; 7% biomass; 6% hydro
Load Zone Source of Renewables • Salt Lake City • Biomass, wind (WY, ID, UT) and geothermal • San Francisco • Biomass, solar (CA) and geothermal • Sacramento • Wind (CA), solar (CA) • Denver • Wind (WY)