Download
1 / 64
650 likes | 795 Vues
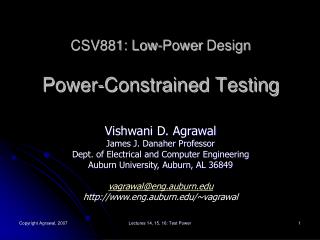
CSV881: Low-Power Design Power-Constrained Testing. Vishwani D. Agrawal James J. Danaher Professor Dept. of Electrical and Computer Engineering Auburn University, Auburn, AL 36849 vagrawal@eng.auburn.edu http://www.eng.auburn.edu/~vagrawal. Power Considerations in Design.

E N D
CSV881: Low-Power DesignPower-Constrained Testing Vishwani D. Agrawal James J. Danaher Professor Dept. of Electrical and Computer Engineering Auburn University, Auburn, AL 36849 vagrawal@eng.auburn.edu http://www.eng.auburn.edu/~vagrawal Lectures 14, 15, 16: Test Power
Power Considerations in Design • A circuit is designed for certain function. Its design must allow the power consumption necessary to execute that function. • Power buses are laid out to carry the maximum current necessary for the function. • Heat dissipation of package conforms to the average power consumption during the intended function. • Layout design and verification must account for “hot spots” and “voltage droop” – delay, coupling noise, weak signals. Lectures 14, 15, 16: Test Power
Testing Differs from Functional Operation Other chips VLSI chip System outputs System inputs system Functional outputs Functional inputs Lectures 14, 15, 16: Test Power
Basic Mode of Testing Packaged or unpackaged device under test (DUT) DUT output for comparison with expected response stored in ATE VLSI chip Test vectors: Pre-generated and stored in ATE Power Clock Automatic Test Equipment (ATE): Control processor, vector memory, timing generators, power module, response comparator Lectures 14, 15, 16: Test Power
Functional inputs: Functionally meaningful signals Generated by circuitry Restricted set of inputs May have been optimized to reduce logic activity and power Test vectors: Functionally irrelevant signals Generated by software to test modeled faults Can be random or pseudorandom May be optimized to reduce test time; can have high logic activity May use testability logic for test application Functional Inputs vs. Test Vectors Lectures 14, 15, 16: Test Power
An Example VLSI chip in system operation 8-bit 1-hot vectors Binary to decimal converter VLSI chip 3-bit random vectors system VLSI chip under test VLSI chip High activity 8-bit test vectors from ATE Lectures 14, 15, 16: Test Power
Comb. Circuit Power Optimization • Given a set of test vectors • Reorder vectors to minimize the number of transitions at primary inputs Combinational circuit (tested by exhaustive vectors) 01010101 00110011 00001111 11 transitions 01111000 Rearranged vector set 00110011 produces 7 transitions 00011110 Lectures 14, 15, 16: Test Power
Reducing Comb. Test Power Original tests: V1 V2 V3 V4 V5 1 3 4 V1 V2 V3 1 1 0 0 0 1 0 1 0 0 1 0 1 0 1 1 0 1 1 1 3 1 2 3 2 1 V4 V5 10 input transitions 2 Reordered tests: V1 V3 V5 V4 V2 1 0 0 0 1 1 1 0 0 0 1 1 1 0 0 1 1 1 1 0 Traveling salesperson problem (TSP) finds the shortest distance closed path (or cycle) to visit all nodes exactly once. But, we need an open loop solution. 5 input transitions Lectures 14, 15, 16: Test Power
Open-Loop TSP 1 • Add a node V0 at distance 0 from all other nodes. • Solve TSP for the new graph. • Delete V0 from the solution. 3 4 V1 V2 V3 0 0 3 0 2 1 V0 2 3 1 V4 V5 0 2 0 Lectures 14, 15, 16: Test Power
Combinational Vector Ordering • TSP has exponential complexity; good heuristics are available. • For other extensions: • V. Dabholkar, S. Chakravarty, I Pomeranz and S. Reddy, “Techniques for Minimizing Power Dissipation in Scan and Combinational Circuits During Test Application,” IEEE Trans. CAD, vol. 17, no. 12, pp. 1325-1333, Dec. 1998. • Typical average power saving: • 30-50% • 50-60% with vector repetition (to satisfy peak power) • ? ? ? With inserted vectors (to satisfy peak power) Lectures 14, 15, 16: Test Power
Traveling Salesperson Problem • A. V. Aho, J. E. Hopcroft anf J. D. Ullman, Data Structures and Algorithms, Reading, Massachusetts: Addison-Wesley, 1983. • E. Horowitz and S. Sahni, Fundamentals of Computer Algorithms, Computer Science Press, 1984. • B. R. Hunt, R. L. Lipsman, J. M. Rosenberg, K. R. Coombes, J. E. Osborn and G. J. Stuck, A Guide to MATLAB for Beginners and Experienced Users, Cambridge University Press, 2006. Lectures 14, 15, 16: Test Power
Example: Branch and Bound Method • A combinational circuit is tested by a set of five vectors. The test system initializes to the first vector 0000, which should be retained as the starting vector. Remaining vectors can be arbitrarily sequenced. Find the minimum energy test sequence. How much does your sequence save over the original sequence? The given test vector sequence is: Vector number 1 2 3 4 5 0 1 1 0 1 0 1 0 1 0 0 1 0 1 0 0 1 0 0 1 Lectures 14, 15, 16: Test Power
Begin with a Greedy Solution Designated start 1 2 4 5 • 2 • 1 2 1 2 4 3 4 3 3 Lectures 14, 15, 16: Test Power
Branch and Bound Search Slack = 6 1 Edge weight = 4 2 1 2 Slack = 2 2 3 5 4 3 2 1 3 2 3 All searches terminate before reaching leaf node. Minimum path length = 6 3 4 5 2 4 5 2 S = 0 S = 0 4 Slack = – 1 2 4 Terminate search when slack ≤ 0 2 4 Greedy path Length = 6 Lectures 14, 15, 16: Test Power
C6288: Test Vector Ordering Paul Wray, “Minimize Test Power for Benchmark Circuit c6288 by Optimal Ordering of Vectors,” Class Project, ELEC 5270, Spring 2009. PowerPoint Presentation and Report: www.eng.auburn.edu/~vagrawal/COURSE/E6270_Spr09/course.html Lectures 14, 15, 16: Test Power
Scan Testing Primary outputs Primary inputs Combinational logic Scan-out SO Scan flip- flops D’ D SO D 1 0 Scan enable SE DFF mux D’ SI Scan-in SI SE Lectures 14, 15, 16: Test Power
Some Properties of Scan Testing • Two modes of operation: • Normal mode • Scan mode • Three-step test application: • Scan-in: sets inputs of logic in scan mode. • Capture: captures logic outputs in normal mode. • Scan-out: observes captured outputs in scan mode. • Tests are non-functional; some tests may consume excess power and could have been intentionally avoided in functional mode. Lectures 14, 15, 16: Test Power
Example: State Machine Functional transitions Functional state transitions S1 S5 S2 S4 S3 State encoding S1 = 000 S2 = 001 S3 = 010 S4 = 011 S5 = 100 Lectures 14, 15, 16: Test Power
Reduced Power Design Functional transitions Functional state transitions S1 S5 S2 S4 S3 Reduced power state encoding S1 = 000 S2 = 011 S3 = 001 S4 = 010 S5 = 100 Lectures 14, 15, 16: Test Power
Scan Testing: Shift-in, Shift-out Scan transitions Primary inputs Primary outputs Combinational logic Scan-out 100 FF=0 FF=0 FF=1 Shift-out transition Scan-in 010 Shift-in transition Shift-in transitions = Σ (scan chain length – position of transition) Shift-out transitions = Σ (position of transition) Lectures 14, 15, 16: Test Power
Scan Testing: Capture Primary inputs 1 0 Primary outputs 1 1 Combinational logic Capture transitions: 3 Note that 101 is not a functional state in the reduced power state encoding. 1 0 1 FF=0 FF=1 FF=0 Lectures 14, 15, 16: Test Power
A Four Flip-Flop Example Combinational Logic 0 1 0 1 0 1 0 1 0 0 0 1 0 0 0 1 0 0 0 0 Scanout 10 transitions F4 F3 F2 F1 0 0 0 0 0 1 0 1 Lectures 14, 15, 16: Test Power
Change Scan Chain Order Combinational Logic 0 0 0 0 0 1 1 0 0 0 0 0 0 0 0 1 0 0 0 0 F4 F3 F2 F1 2 transitions 0 Scanout 0 0 1 1 0 0 0 Lectures 14, 15, 16: Test Power
Capture Power Combinational Logic 1 0 1 1 Input vector 0 1 0 1 Output vector 3 transitions F4 F3 F2 F1 1 Scanout 0 1 Next vector states 0 Lectures 14, 15, 16: Test Power
Vector Order - Select Next Vector Combinational Logic 1 0 1 1 Input vector 0 1 0 1 Output vector 3 transitions F4 F3 F2 F1 1 Scanout 1 0 Captured response Next vector states 1111 or 1100 or 0011 Select 1100 1 Lectures 14, 15, 16: Test Power
Dynamic Power of Scan Test • Capture power can be reduced: • A vector generation problem • Shift-in and shift-out power is reduced by vector ordering and scan chain ordering • Construct a flip-flop node graph; edges weighted with shift in/shift out activity • Find shortest distance Hamiltonian paths between all node pairs • Select the path that minimizes shift power Lectures 14, 15, 16: Test Power
Shift-in and Shift-out Matrices N Scan flip-flops: F1 through FN; M vectors: V1 through VM F1 → F2 · → · Fj· → ·Fk · → · FN F1 → F2 · → · Fj · → · Fk · → · FN V1 0 1 ··· 1 ··· 0 ··· 1 1 1 ··· 1 ··· 0 ··· 0 V2 1 1 ··· 0 ··· 0 ··· 0 0 1 ··· 1 ··· 1 ··· 0 ··· ··· ··· ··· ··· ··· ··· ··· ··· ··· ··· ··· ··· ··· ··· ··· ··· Ij Ik Oj Ok ··· ··· ··· ··· ··· ··· ··· ··· ··· ··· ··· ··· ··· ··· ··· ··· ··· VM 0 0 ··· 1 ··· 1 ··· 0 1 0 ··· 0 ··· 0 ··· 1 Flip-flop states for test input Test output states Lectures 14, 15, 16: Test Power
A Complete Graph wjk = Hamming(Ij, Ik) + Hamming(Oj, Ok) w12 F1 F2 w13 w23 w16 w24 w26 w14 w25 w15 F3 F6 w36 w46 w35 w56 w34 F5 F4 w45 Lectures 14, 15, 16: Test Power
Graph Solutions for Scan Power • High complexity of Hamiltonian path finding requires use of heuristics. • Average power saving: ~30-50% logic, ~10-20% flip-flops. • Y. Bonhomme, P. Girard, Landrault, and S. C. Pravossoudovtich, “Power Driven Chaining of Flip-Flops in Scan Architectures,” Proc. International Test Conf., 2002, pp. 796–803. • Y. Bonhomne, P. Girard, L. Guiller, Landrault, and S. C. Pravossoudovtich, “Power-Driven Routing-Constrained Scan Chain Design,” J. Electronic Testing: Theory and Applications, vol. 20, no. 6, pp. 647–660, Dec. 2004. Lectures 14, 15, 16: Test Power
Low Power Scan Flip-Flopwith Gated Data SO SO D 1 0 D mux D’ mux D’ DFF DFF SI SI SE CK CK SE SFF: Scan FF cell SFF-GD: Gated data scan FF cell Lectures 14, 15, 16: Test Power
Low Power Scan Flip-Flopwith Gated Clock and Data SO D 1 0 mux D’ DFF SI CK SE SFF-GCKD: Gated clock and data scan FF cell Lectures 14, 15, 16: Test Power
s5378: Normal Mode Operation • 1,000 random vectors • Clock period = 50ns • Technology: TSMC025 Lectures 14, 15, 16: Test Power
s5378: Scan Test • Mentor Graphics Fastscan, 98.9% coverage • Clock period = 50ns • Technology: TSMC025 Lectures 14, 15, 16: Test Power
Reference for Power Analysis • J. D. Alexander, Simulation Based Power Estimation For Digital CMOS Technologies, Master’s Thesis, Auburn University, Dept. of ECE, December 2008. Lectures 14, 15, 16: Test Power
Low Power Scan Flip-FlopReducing Shift Power Scanin D Q FFN D Q FF2 D Q FF1 Scanout Multi-phase clock generator Scan Enable CLK Lectures 14, 15, 16: Test Power
Built-In Self-Test (BIST) BIST Controller Linear feedback shift register (LFSR) Pseudo-random patterns Circuit under test (CUT) Circuit responses Multiple input signature register (MISR) Clock C. E. Stroud, A Designer’s Guide to Built-In Self-Test, Boston: Springer, 2002. Lectures 14, 15, 16: Test Power
Test Scheduling Example R1 R2 M2 M1 R3 R4 A datapath Lectures 14, 15, 16: Test Power
BIST Configuration 1: Test Time LFSR1 LFSR2 T2: test for M2 M2 M1 Test power T1: test for M1 MISR1 MISR2 Test time Lectures 14, 15, 16: Test Power
BIST Configuration 2: Test Power R1 LFSR2 M2 M1 Test power T1: test for M1 T2: test for M2 MISR1 MISR2 Test time Lectures 14, 15, 16: Test Power
Testing of MCM and SOC • Test resources: Typically registers and multiplexers that can be reconfigured as test pattern generators (e.g., LFSR) or as output response analyzers (e.g., MISR). • Test resources (R1, . . .) and tests (T1, . . .) are identified for the system to be tested. • Each test is characterized for test time, power dissipation and resources it requires. Lectures 14, 15, 16: Test Power
Resource Allocation Graph(A Bipartite Graph) T1 T2 T3 T4 T5 T6 R1 R2 R3 R4 R5 R6 R7 R8 R9 Lectures 14, 15, 16: Test Power
Definition: Bipartite Graph • A bipartite graph(or bigraph) is a graph whose vertices can be divided into two disjoint sets U and V such that every edge connects a vertex in U to one in V; that is, U and V are independent sets. • Equivalently, a bipartite graph is a graph that does not contain any odd-length cycles. • A bipartite graph has no clique of size 3 or larger. • A bipartite graph can be colored with two colors (chromatic number = 2). Lectures 14, 15, 16: Test Power
Test Compatibility Graph (TCG) T1 (2, 100) T6 (1, 100) T2 (1,10) T5 (2, 10) T3 (1, 10) T4 (1, 5) Power Test time Tests that form a clique can be performed concurrently. Pmax = 4 Lectures 14, 15, 16: Test Power
Definition: Clique • A clique is an undirected graph in which every vertex is connected to every other vertex . • A clique is a complete graph. • the maximum clique problem, is to find the largest clique in a graph. • Finding whether there is a clique of a given size in a graph (the clique problem) is NP-complete. • C. Bron and J. Kerbosch (1973): “Algorithm 457: Finding All Cliques of an Undirected Graph.,” Communications of the ACM, vol. 16, no. 9. ACM Press: New York. Lectures 14, 15, 16: Test Power
A Similar Definition: SCC • A directed graph is called strongly connected if there is a path from each vertex in the graph to every other vertex. • Strongly connected components(SCC) of a directed graph are its maximal strongly connected subgraphs. If each strongly connected component is contracted to a single vertex, the resulting graph is a directed acyclic graph (DAG). • T. H. Cormen, C. E. Leiserson, R. L. Rivest, and C. Stein. Introduction to Algorithms, Second Edition, MIT Press and McGraw-Hill, 2001, ISBN 0-262-03293-7. • Finding SCCs, O(V+E) Lectures 14, 15, 16: Test Power
Find All Cliques in TCG Lectures 14, 15, 16: Test Power
Integer Linear Program (ILP) • For each clique (test session) i, define: • Integer variable, xi = 1, test session selected, or xi = 0, test session not selected. • Constants, Li = test length, Pi = power. • Constraints to cover all tests: • T1 is covered if x1+x2+x3+x4+x5+x6+x11 ≥ 1 • Similar constraint for each test, Tk • Constraints for power: Pi × xi ≤ Pmax Lectures 14, 15, 16: Test Power
ILP Objective and Solution • Objective function: • Minimize Σ Li × xi all cliques • Solution: • x3 = x8 = x10 = 1, all other xi’s are 0 • Test session 3 includes T1 and T6 • Test session 8 includes T2 and T5 • Test session 10 includes T3 and T4 • Test length = L3 + L8 + L10 = 120 • Peak power = max {P3, P8, P10} = 3 (Pmax = 4) Lectures 14, 15, 16: Test Power
A System Example: ASIC Z* RAM 2 Time=61 Power=241 RAM 3 Time=38 Power=213 Random logic 1, time=134, power=295 Random logic 2, time=160, power=352 ROM 1 Time=102 Power=279 ROM 2 Time=102 Power=279 RAM 4 Time=23 Power=96 RAM 1 Time=69 Power=282 Reg. file Time = 10 Power=95 * Y. Zorian, “A Distributed Control Scheme for Complex VLSI Devices,” Proc. VLSI Test Symp., April 1993, pp. 4-9. Lectures 14, 15, 16: Test Power
ASIC Z Test Schedule-Heuristic Solution 1200 900 600 300 Reg. file Power limit = 900 RAM 2 RAM 3 Random logic 1 Power ROM 1 Random logic 2 ROM 2 RAM 1 RAM 4 0 100 200 300 400 Test time 331 R. M. Chou, K. K. Saluja and V. D. Agrawal, “Scheduling Tests for VLSI Systems under Power Constraints,” IEEE Trans. VLSI Systems, vol. 5, no. 2, pp. 175-185, June 1997. Lectures 14, 15, 16: Test Power