Download
1 / 1
10 likes | 120 Vues
An Investigation into Selection Constraints in RNA Genes Naila Mimouni, Rune Lyngsoe and Jotun Hein Department of Statistics, Oxford University. Aim • A robust approach to investigate selection patterns acting on ncRNAs. Motivation • Selection in RNA: + No RNA equivalent of Ka/Ks.

E N D
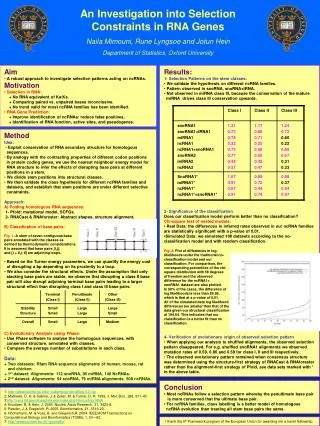
An Investigation into Selection Constraints in RNA Genes Naila Mimouni, Rune Lyngsoe and Jotun Hein Department of Statistics, Oxford University Aim • A robust approach to investigate selection patterns acting on ncRNAs. Motivation • Selection in RNA: + No RNA equivalent of Ka/Ks. + Comparing paired vs. unpaired bases inconclusive. + No trend valid for most ncRNA families has been identified. • RNA Gene Prediction: + Improve identification of ncRNAs: reduce false positives. + Identification of RNA function, active sites, and pseudogenes. Results: 1- Selection Patterns on the stem classes: • We validate the hypothesis on different ncRNA families. • Pattern observed in snoRNA, snoRNA+tRNA. • Not observed in miRNA class III, because the conservation of the mature miRNA drives class III conservation upwards. 2- Significance of the classification Does our classification model perform better than no classification? Chi-square test of nested models: • Real Data: the differences in inferred rates observed in our ncRNA families are statistically significant with a p-value of 0.01. •Simulated Data: we simulated 100 datasets according to the no-classification model and with random classification. Fig. 2: Plot of differences in log- likelihoods under the traditional no- classification model and our classification. For comparison, the corresponding percentiles of the chi- square distribution with 58 degrees of freedom and the observed difference for the ncRNA1+ snoRNA1 dataset are also plotted. In 90% of the cases, the difference of log likelihoods is less than 85.95, which is that at a p-value of 0.01. All of the simulated data log likelihood differences are smaller than that of the data given our structural classification at 194.64. This indicates that our classification is a better fit than no classification. 4- Verification of evolutionary origin of observed selection pattern • When applying our analysis to shuffled alignments, the observed selection pattern disappeared. For e.g. shuffled snoRNA1 alignments we observed mutation rates of 0.59, 0.86 and 0.59 for class I, II and III respectively. • The observed evolutionary pattern remained when consensus structure was determined using the structure-first strategy of RNACast & RNAforester rather than the alignment-first strategy of Pfold, see data sets marked with * in the above table. Method Idea: • Exploit conservation of RNA secondary structure for homologous sequences. • By analogy with the contrasting properties of different codon positions in protein coding genes, we use the nearest neighbour energy model for RNA structure to infer the effects of disrupting base pairs at different positions in a stem. • We divide stem positions into structural classes. • We then validate the class hypothesis for different ncRNA families and datasets, and establish that stem positions are under different selective constraints. Approach: A) Folding homologous RNA sequences: 1- Pfold: mutational model, SCFGs. 2- RNACast & RNAforester: Abstract shapes, structure alignment. B) Classification of base pairs: Fig. 1: A stem of seven contiguous base pairs annotated with the classes as defined by thermodynamic considerations. It is assumed that base pairs [i,j], and [i + 6,j- 6] are adjoining loops. • Based on the Turner energy parameters, we can quantify the energy cost of disrupting a bp depending on its proximity to a loop. • We also consider the structural effects. Under the assumption that only stacking base pairs are stable, we observe that disrupting a class II base pair will also disrupt adjoining terminal base pairs leading to a larger structural effect than disrupting class I and class III base pairs. C) Evolutionary Analysis using Phase: • Use Phase software to analyse the homologous sequences, with conserved structure, annotated with classes. • Compare the average number of substitutions in each class. Data: + Two datasets: Rfam RNA sequence alignments of human, mouse, rat and chicken. + 1st dataset: Alignments: 112 snoRNA, 95 miRNA, 140 NcRNAs. + 2nd dataset: Alignments: 54 snoRNA, 79 miRNA alignments, 508 ncRNAs. Conclusion • Most ncRNAs follow a selection pattern whereby the penultimate base pair is more conserved that the ultimate base pair. • For ncRNA families, class labelling is a better model of homologous ncRNA evolution than treating all stem base pairs the same. 1: http://www.bioinfo.rpi.edu/~zukerm/cgi-bin/efiles-3.0.cgi 2: Mathews, D. H. & Sabina, J. & Zuker, M. & Turner, D. H. 1999. J. Mol. Biol., 288, 911-40. 3:http://rana.lbl.gov/drosophila/wiki/index.php/Noncoding_RNA 4: Knudsen, B. & Hein, J. 2003. Nucleic Acids Research, 31, 3423-8. 5: Reeder, J. & Giegerich, R. 2005. Bioinformatics, 21, 3516-23. 6: Höchsmann, M. & Voss, B. and Giegerich,R. 2004. IEEE/ACM Transactions on Computational Biology and Bioinformatics (TCBB), 1, 53—62. 7: http://www.cs.man.ac.uk/~gowridhv/ I thank the 6th Framework program of the European Union for awarding me a travel fellowship.