Download
1 / 64
670 likes | 915 Vues
Thermohaline circulation ●The meridional overturning ●Deep water formation and property Antarctic Bottom Water North Atlantic Deep Water Antarctic Intermediate Water ●Dynamical constraint: Stommel-Arons model. The Concept of Thermohaline Circulation.

E N D
Thermohaline circulation ●The meridional overturning ●Deep water formation and property Antarctic Bottom Water North Atlantic Deep Water Antarctic Intermediate Water ●Dynamical constraint: Stommel-Arons model
The Concept of Thermohaline Circulation The wind-driven circulation (the Ekman and Sverdrup movements) does not reach below the upper kilometre of the ocean. Water renewal below that depth is achieved by currents which are driven by density differences produced by temperature (thermal) and salinity (haline) effects. The associated circulation is therefore referred to as the thermohaline circulation. Since these movements are probably weak, it is often impractical to use current meters to measure them directly; they are usually deduced from the distribution of water properties and the application of geostrophy.
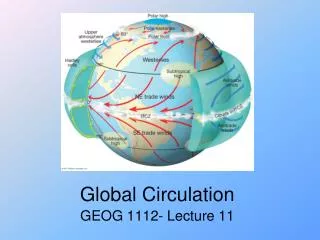
Heating at low latitudes Surface heat at the equator and cooling at higher latitudes generate meridional density difference that drives a overturning cell The overturning circulation is weak because the heat is in the shallow mixed layer The salinity effect (e.g., evaporation at subtropics and precipitation near the equator) enhances the tropical-subtropical thermal cell but counters the cooling in the higher latitudes with freshening The upper thermohaline cell is of minor importance
Cooling at high latitudes • Net heat loss from the oceans at high latitudes • Cooling of the surface water and increase in density • Sink and replace deeper water • Density can also be increased when ice freezes out, ejecting salt and thus increasing the weight of the remaining water • Thermohaline circulation of the ocean originates from sinking to mid-depth or even to the ocean bottom, followed by horizontal flow.
Interesting facts The vertical distribution of T & S in the central Atlantic is similar to the north-south distribution of T & S at the surface. Almost all isopycnals come in contact with the atmosphere somewhere on the globe
Questions Does this imply that air-sea interaction at the surface affect the range of ocean water or even determine the ocean stratification? Are there “flows” along the isopycnals that transport these properties? The “flow” here could be intermittent and irregular The T & S patterns do not allow us to see the flow rates or mechanisms The process whereby ocean surface characteristics are transmitted to deeper layers is known as ventilation.
Water Mass Formation The driving force for the thermohaline circulation is water mass formation. Water masses with well-defined temperature and salinity characteristics are created by surface processes in specific locations; they then sink and mix slowly with other water masses as they move along. The two main processes of water mass formation are deep convection and subduction. Both are linked to the dynamics of the mixed layer at the surface of the ocean; so it is necessary to discuss thermohaline aspects of the upper ocean first.
How to track the water masses?temperature-salinity diagram Below the surface layer in permanent contact with the atmosphere, temperature and salinity are conservative properties, i.e., they can only be changed by mixing and advection. All other properties of sea water such as oxygen, nutrients etc. are affected by biological and chemical processes and therefore non- conservative. Water masses can therefore be identified by their temperature-salinity (T-S) combinations.
Examples of temperature-salinity (TS)-diagrams. The diagrams on the left show the distribution of temperature (red) and salinity (cyan) with depth; the diagrams on the right show the corresponding TS-diagrams. Top: layering of a warm and saline water mass found at 0 - 300 m depth above a cold and fresh water mass found at 300 - 600 m. The full lines show the situation before mixing, the broken lines after mixing. The TS-diagram shows the two water masses as TS points. Before mixing only the two points are seen in the TS-diagram. Mixing connects the two TS-points by a straight line. Bottom: layering of three water masses (intrusion of a low salinity water mass at 300 - 600 m depth). Again, the full lines show the situation before mixing, the broken lines after mixing. The TS- diagram shows two mixing lines; the erosion of the intermediate salinity minimum by mixing is seen by the departure of the broken curve from the original water mass point.
Double diffusion: Salt Figure Warm, salty water overlying a cooler, fresher layer Individual salt fingers are a few millimeters across and up to 25 cm long Lateral diffusion occurs between the fingers and produces a uniform layer As a result, layers develop with sharply defined interfaces
Double Diffusion: Layering Cold, fresh layer, over warm salty layer
Waters filled in different deep ocean basins have distinct characters
Water mass formation by deep convection Deep convection occurs in regions of weak density stratification (mostly in polar and subpolar regions). When the water in the mixed layer gets denser than the water below, it sinks to great depth, in some regions reaching to the ocean floor. The density increase can be achieved by cooling or an increase in salinity (either through evaporation or through brine concentration during freezing) or both.
Sea Ice Covers 6-8% of ocean High reflectivity (Albedo 30-40%) (A barrier to solar radiation) Always colder than underline water (heat flux from ocean to the ice)
Halocline • A layer of rapidly changing salinity at about 50-200 meters in high latitudes of ice covered regions • The cooling temperature mostly freezes fresh water into ice crystals, leaving salt trapped in brine pocket • The unfrozen water sink and mix with sea water below
Track of Antarctic Bottom Water and North Atlantic Deep Water
Near Boundery Sinking 1). Dense water forms over the continental shelf, due to surface cooling and salt rejection during ice formation. The resulting convection yields cold, salty water at the depth on the shelf 2). Horizontal density gradient parallel to the coast produces local circulations for the resevior to empty 3). Mixing with an off-shore water mass increases the density (cabbeling) 4). Dense, salty water on the shelf desends the slope under a balance of Coriolis, gravity, and frictional forces. The thermobaric effect may also contribute to the sinking
Sources of Antarctic Bottom WaterSinking around Antarctica The bottom water originates in several areas of the Antarctic continental shelf, where water is made sufficiently cold and saline that, in flowing down the continental slope and mixing with the surrounding deep water, it is dense enough to reach the floor of the ocean. In order of decreasing amount and extent of influence on the deep water property distributions—and presumably, therefore, of rate of bottom water production—these regions are the Weddell Sea, the Ross Sea, and the Adélie Coast; perhaps there is some production off Enderby Land, too.
Weddell Sea The deep water is formed at the continental shelf, which then flow into the Weddell Sea (-2oC, S=34.4~34.8, σt=27.96) The shelf water mixes rapidly into the water above to form the Weddell Sea Bottom Water (θ= –0.7o ~ –0.8oC, σt=27.9). It is estimated that the net flow out of the Weddell Sea is about 16 x 106 m3/s. The Weddell Sea Bottom Water is very cold but fresher than the overlaying water (S~34.52).
Observations made in 1968 on a station line running eastward from Antarctic Peninsula into Weddell Sea.
Observations made in 1968 on a station line running eastward from Antarctic Peninsula show a 200-m thick layer of relatively cold, fresh, low-silica bottom water on the slope, extending onto the floor of the Weddell Sea. The evidence points to a flow of shelf water down the slope, entraining and being diluted by the surrounding water on its way. (The continental shelf is unreachable throughout a year because of ice cover). Potential temperature Salinity Dissolved silica concentration Similar sections near 40oW, 29oW, 10oW-20oW show that the down slope flow gradually diminishes to the eastward.
The distribution of bottom potential temperature in the Weddell Sea demonstrates that the newly formed bottom water leaves the continental slope mainly at the northern tip of the Antarctic Peninsula, near 63o-65oS. At the edge of the continental shelf, the water has θ= –1.2 to –1.4oC the rate of sinking is 2-5x10⁶ m3/s.
Other Sources of the Bottom Water Ross Sea More saline and denser water (S>34.72, σt=28.1 ) are found near the bottom of ocean in the southwestern Pacific, north of the Ross Sea near the mid-ocean ridge (about 65oS), and close to Antarctica south of Australia. This high salinity bottom water can be traced back to the deep depressions on the shelf of Ross Sea. The cold saline shelf water has been observed to descend the western continental slope in a manner similar to that of the down slope flow in the Weddell Sea. The off shelf flux is roughly 0.6 x 10⁶ m3/s Adélie Coast Deep depressions of much smaller area on the continental shelf of the Adélie Coast of Antarctica. They are filled below their sill depths with water temperature close to the freezing point, and of salinity 34.4—34.7, probably as a result of deep convection associated with winter sea-ice formation. Such water spilling over the sills forms a layer a few tens of meters thick on the near-by continental slope, underlying the high salinity bottom water from the Ross Sea. The flow down the continental slope appears intermittent. This low-salinity bottom water mixes into the Ross Sea water rapidly enough that it has not been detected far from the continental rise near its point of origin. Enderby Land Small amount of bottom water production.
Antarctic Bottom Water • Bottom water from these several sources mixes with the warmer, more saline water above (the Antarctic Circumpolar Water) to form the “Antarctic Bottom Water” of the world ocean. Wedell and Ross Seas. (σt =27.96, T=0.3oC, S=34.7-34.8 at sub-Antarctic zone 40-50oS). • The Antarctic Bottom Water is the coldest, and the densest, deep water in the open ocean, detectable into northern latitudes by low temperatures close to the bottom. • The Antarctic Bottom Water flows into the South Atlantic and eastward through the Indian and Pacific sectors of the Southern Ocean. Below 4000m depth, all Atlantic Ocean basins are mainly occupied by the Antarctic Bottom Water.
Passages of AABW The path of Antarctic Bottom Water is strongly affected by the topography. The water mass spreads northward from both east and west of the Mid-Atlantic Ridge. On the western side, it is detectable well into the northern hemisphere past 50oN. On the eastern side, the water flows along the Walvis Ridge (20oS-30oS). Since the basin is closed in the north below the 3000m level at the Walvis Ridge, its northward progress comes to a halt there. The flow follows the depth contours in cyclonic motion, and the bottom water leaves the basin on the eastern side toward s the Indian Ocean. Antarctic Bottom Water enters the eastern basins north of the Walvis Ridge near the equator by passing the Romanche Fracture Zone. As a result, potential temperature increases slowly both northward and southward from the equator in the eastern basins.
Open Ocean Sinking A background cyclone gyre circulation in response to winds raise a dome of isotherm (scale~100km) Density increase in the upper ocean due to surface cooling to form the preconditioning pool Mixed layer penetration into the intermediate water dome Narrow plumes with width on the order of 1km develop, with downward speed as high as 10 cm/s Vertical homogeneous fluid forms Horizontal spreading of the deep water
The Sources of the North Atlantic Deep Water The next densest water is the North Atlantic Deep Water (NADW, Temperature 2.5oC, salinity 35.03). NADW fills the depth range between 1000 m and 4000 m. In vertical sections, it is seen as a layer of relatively high salinity (>34.9) and oxygen (above 5.5ml/L) extending southward from the Labrador Sea to the Antarctic Divergence. More detailed inspection reveals two oxygen maxima within the NADW in the subtropics, at 2000-3000 m and 3500-4000 m depth, indicating the existence of two distinct Deep Water varieties. In fact, there is also a third branch. The three branches are called as the lower, middle, and higher NADW, which show slight density differences and remain vertically layered along their southward paths.
A Cross Section along the Western Atlantic Ocean Antarctic Intermediate Water North Atlantic Deep Water Antarctic Bottom Water Note the minimum in σθ, which seems to imply a vertical instability. However, it is because σθ (with θ relative to surface) is not adequate. In fact, using σ4 (with potential temperature with relative to 4000 meters) gets stable stratification.
Major Parts of the North Atlantic Deep Water are formed in the Greenland and Norwegian Seas as well as the Labrador Sea.
Greenland Sea and Norwegian Sea: The lower NADW The NADW is mainly formed in the Greenland Sea and the Norwegian Sea (80%). A submarine ridge extending from Greenland to Scotland limits the water exchange between the North Atlantic Ocean and the Norwegian Sea. In the Greenland Sea, relatively light incoming water from the North Atlantic becomes denser by strong local winter cooling and sinks (the open ocean process, different from the shelf water in the Antarctic). The sinking is associated with the passage of storm systems, each event lasting less than a week. The Greenland Sea Deep Water is combined with the waters from the Arctic shelf region to form the Arctic Bottom Water. The Norwegian Sea is the mixing basin where Arctic Bottom Water obtain its final characteristics (potential temperature is close to -0.95oC and Salinity 34.9). The dense Arctic Bottom Water flows into the North Atlantic over the ridge connecting Greenland and British isles.
The Faroe Bank Channel is about 800 m, outflow roughly 1x10⁶ m3/s (1 Sv). The second channel passes over the ridge between the Faroe Islands and Iceland (sill depth 300-400 m, transport 1 Sv). The combined Iceland-Scotland overflow, after leaving the ridge is about 5 Sv (3 Sv is entrained Atlantic water). This overflow continues southward against the eastern side of the Mid-Atlantic Ridge, and passes through the Gibbs Fracture Zone near 53oN into the Labrador Basin. Its westward transport is still 5 x 10⁶ m3/s (little direct flow into low latitudes). This current then flows northward in the eastern Labrador basin, and, south of Greenland, joins the third flow from the Denmark Strait (about 600 m).
The total transport is 10x106 m3/s for the full flow south of Greenland, thereby indicating a contribution of 5x10⁶ m3/s from the Denmark Strait overflow. Part of it is Atlantic water entrained by the Denmark Strait overflow as it descends the Greenland continental slope. Even though the overflows on either side of Iceland originate from the same Norwegian Sea water, the Denmark Strait overflow is distinctly colder and fresher (θ=0.0-0.2oC, S=34.88-34.93) than Iceland-Scotland overflow (θ=1.8-3oC, S=34.98-35.03), mainly because the upper kilometer Atlantic water entrained in the east is warmer and more saline. The overflow is highly variable. Measurements show that overflow is coming in bursts 1-2 day long, with speeds up to 140 cm/s, separated by 1 to several days. It probably reflects the fact the overflow is generated by cyclonic winds from intense storm systems that lift up the bottom water by a hundred meters or so behind the sill. The lower NADW has its origin in the Greenland-Iceland-Scotland overflow region, which indicates that some Deep Water is formed before the Arctic Bottom Water reaches the Labrador Sea through mixing of the overflow water with the surrounding waters. East of the Mid-Atlantic Ridge, this is the only mechanism for the formation of Deep Water and the lower NADW is particularly prominent in the eastern basins. Therefore, it is also called as the eastern NADW.
Labrador Sea: Middle NADW For a long time, the origin of the NADW was thought to be in the Labrador and Irminger Seas off the southern tip of the Greenland where winter cooling of relatively saline water was considered to cause it to sink to considerable depths and then spread southward. Now it is generally recognized that the NADW is mainly produced in the Greenland and Norwegian Seas. However, sinking in the Labrador Sea is still a major source of the formation of NADW. In the region south of the southern tip of Greenland, the water properties in late winter are almost uniform from the surface to near bottom. The explanation for this situation was that the deep water was actually forming at the time. This Labrador Sea Water is the product of deep convection during the winter months. However, the deep convection is not an annual event. Estimates are that they occur in 6 out of 10 years. Moreover, no “event” of large-scale convective overturn was observed yet. The processes causing the convection in this region are not clear, probably through small space and time scales. The middle (or western) NADW can be traced back to the surface near 55oN, which reflects the fact that it is formed by mixing the Arctic Bottom Water with the deep water produced in the Labrador Sea. The transport is estimated to be 3.5x10⁶ m3/s.
From this column of the Labrador Sea, a tongue of 3o to 3.25oC water extended south at depths of 2000 to 2500 m. This water had a high oxygen content; even at 2000 m depth it was still 90% of that at the surface.
Mediterranean Sea: Upper NADW The rate of outflow through the Straits of Gilbratar is estimated from the overall salt budget for the Mediterranean Sea and current measurements; both agree on a mean of about 1x10⁶ m3/s. The Mediterranean Water Mass (MW) leaves the Strait of Gilbratar with T=13.5oC and S=37.8. Within 250km its T & S are reduced by mixing to 11o-12oC and 36-26.2. By the time the outflow current completes its descent and departs from the continental slope, its volume transport has increased, by entrainment of Atlantic water, to roughly 10x106 m3/s.
The Smax marking the core of the Mediterranean outflow (named as the Upper NADW by Wüst) is found at about 1200 m in the southeastern North Atlantic. (Relatively high salinities can be detected at least as deep as 3000m.) The MW spreads isopycnally across the ocean, mixing gradually with the Deep Water below. Relative to the other NADW it has higher T & S maximized at 1000m depth near the upper limit of the NADW. MW first flows northward under the influence of the Coriolis force and mixes into the subtropical gyre circulation, eventually spreading southward and westward. The T-S core sinks as the water spreads.
Eddies in the Mediterranean Water The spreading of the Mediterranean Water is not smooth. Instead, it is injected into the NADW in the form of subsurface eddies containing a high proportion of Mediterranean Water in its core, referred to as “meddies”. Meddies limit local mixing and keep the core together over large distance, as far as in the Sargasso Sea. The salinity and temperature anomalies found in the long-term average distribution have to be seen as the result of a process in which many such meddies travel through the upper NADW range at any particular moment in time, slowly releasing their load of extra salt and heat into the surrounding Deep Water.
The Track of the North Atlantic Deep Water Both are more saline at their sources than the ABW, and their salinities are increased somewhat in mid-latitudes of the North Atlantic through mixing with the outflow from the Mediterranean Sea. Although the lower and middle NADW are made dense by cooling, their temperatures are not reduced to freezing point before sinking, but remain high enough that, despite more saline, they are less dense than the Antarctic Bottom Water, and therefore override it. This high-salinity water spreads throughout the South Atlantic, is carried eastward around Antarctica in the Circumpolar Current, and its elevated salinities can be followed into low latitudes of the South Indian and South Pacific Oceans.
Other Major Water Masses Antarctic Circumpolar Water (CPW) Below the surface and extending to the bottom at depths to 4000m. Maximum temperature is 1.5-2.5oC at 300-600m and then decreases to between 0o-0.5oC near the bottom. Salinity 34.7psu. Carried around by Antarctic Circumpolar Current (ACC) and found all around the continent at about the same depth (CPW is probably a mixture of Antarctic Bottom Water and the North Atlantic Deep Water). Antarctic Intermediate Water (AIW) Formed by the sinking of the Antarctic surface water, mostly from convection east of southern Chile and west of southern Argentina. AIW is quite homogeneous (T=2o-3oC, S=34.2) and has density σt=27.4 higher than the water further north. It spreads into all oceans with the Circumpolar Current and continues northward below the surface. It has a thickness of 500 m and forms a tongue of relatively low salinity water with core at 800 to 1000 m at 40oS. AIW mixes with more saline water from above and below during northward movement. (Intermediate Water in the northern hemisphere may be formed by convection or subduction.)
A series of TS-diagrams from the Atlantic Ocean, from 40°S to 40°N, showing the erosion of the salinity minimum associated with Antarctic Intermediate Water along the path of the water mass. The red line traces the salinity minimum produced by the relatively fresh Antarctic Intermediate Water. Color indicates oxygen content. Note how the oxygen content associated with the salinity minimum decreases from south to north, indicating the aging of the Antarctic Intermediate Water. (based on OceanAtlas of J. Osborne, J. Swift and E. P. Flinchem) From M. Tomczak: Introduction to Physical Oceanography http://gaea.es.flinders.edu.au/~mattom/IntroOc/lecture07.html
Sketch of the water mass distribution in the world ocean AABW: Antarctic Bottom Water, CPW: Circumpolar Water, NADW: North Atlantic Deep Water, PDW: Pacific Deep Water, AAIW: Antarctic Intermediate Water, AIW: Arctic Intermediate Water, MedW: Mediterranean Water, RedSW: Red Sea Water, gold: Central Water, brown: surface water. From M. Tomczak: Introduction to Physical Oceanography http://gaea.es.flinders.edu.au/~mattom/IntroOc/lecture07.html