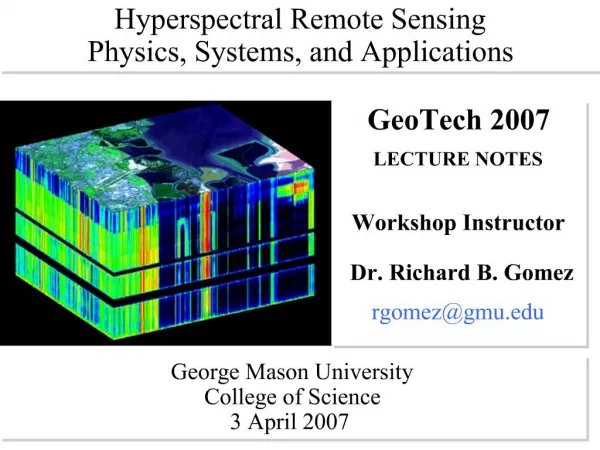
Hyperspectral remote sensing
Hyperspectral remote sensing. Contact: mirza.waqar@seecs.edu.pk. Mirza Muhammad Waqar. Contents. Introduction What is Hyperspectral Sensing Hyperspectral vs Multispectral Data Cube – A way to visualize the data The Ultimate Benefit Imaging Spectrometry Concept Spectrometry


Hyperspectral remote sensing
E N D
Presentation Transcript
Hyperspectral remote sensing Contact: mirza.waqar@seecs.edu.pk Mirza Muhammad Waqar
Contents • Introduction • What is Hyperspectral Sensing • Hyperspectralvs Multispectral • Data Cube – A way to visualize the data • The Ultimate Benefit • Imaging Spectrometry Concept • Spectrometry • Imaging Spectrometry • n-Dimensional Data
Overview • In previous lessons, you were introduced to extraction of thematic information from the spectral content of digital multiband imagery. • You learned to manipulate various • Band combinations for display and analysis • Performed simple classification and change detection using classified and unclassified imagery. • Performed advance classification techniques
Cont… • The same concepts can be applied to hyperspectral imagery, but • Hyperspectral image analysis is much more complex than multispectral
Objectives • Explain the fundamental principles of hyperspectral remote sensing • Explain the georeferencing and radiometric calibration of hyperspectral data • Identify standard hyperspectral mapping products and applications • Explain the basic principles of hyperspectral image analysis
Introduction • Remote sensing involves examination of features observed in several regions of electromagnetic spectrum. • Multispectral remote sensing is based upon use of several broadly defined spectral regions • Hyperspectral remote sensing is based upon examination of many narrowly defined spectral channels.
Cont… • Hyperspectral remote sensing combines imaging and spectroscopy • Generally 100 to 200 or more narrow spectral bands (5 – 10 nanometers wide) • Compared to multispectral sensors with typically 4 to 12 spectral bands (70 – 100 nm wide) • Generates large data sets • Requires new / different analysis methods
The Ultimate Benefit… Diagnostic / identifying characteristics are lost in wide bands
Analysis Approach • Direct identification using diagnostic absorption and reflection features • Comparison to laboratory and field measured spectra
Spectroscopy • Spectroscopy pertains to the dispersion of an object's light into its component colors (i.e. energies) • Spectroscopy can be used to detect individual absorption features due to specific chemical bonds in a solid, liquid, or gas • By performing this dissection and analysis of an object's light, one can infer the physical properties of that object (such as temperature, mass, luminosity and composition, etc.) • Continuous spectra • Discrete spectra • Emission line spectra • Absorption line spectra
Image Spectroscopy • Imaging spectroscopy is a new tool that can be used to map specific materials by detecting specific chemical bonds • It is an excellent tool for environmental assessments, mineral mapping and exploration, vegetation species and health studies, general land management studies, and others
Cont… • Hyperspectral imaging is the simultaneous acquisition of images in many narrow, contiguous, spectral bands • Each pixel in the remotely acquired scene has an associated spectrum similar to the spectra of the material / mineral obtained in the laboratory
Properties of a Spectrometer • Parameters that describe the capability of a spectrometer • Spectral range • Spectral bandwidth • Spectral sampling • Signal-to noise ratio FWHM = Full Width at Half Max
Spectral resolution – Sampling Interval • Spectral resolution = narrowest spectral feature • that can be resolved by a spectrometer (full width at half maximum FWHM) • Spectral sampling interval = interval, in wavelength units, • between data points in the measured spectrum. • Spectral bandwidth • used for spectral sampling interval)
Properties of a Spectrometer • Parameters that describe the capability of a spectrometer • Spectral range • Spectral bandwidth • Spectral sampling • Signal-to noise ratio
PIMA II • PIMA (Portable Infrared Mineral Analyser) • Spectral range 1300 – 2500 nm • Spectral resolution 7nm, interval 2-4 nm • Measurement is made in contact mode • Measurement time 20-60 seconds • Produces reflectance spectra • Spectra measured on a sample area of about 10 mm by 2 mm • Internal illumination (does not need solar illumination) • Internal reflectance standard, wavelength calibration uses internal target
Spectral Libraries • SLI’s are collections of spectra different surface materials. • Often grouped by surface type (vegetation vs. soils vs. man-made materials etc.) and sometimes by grain size fraction (influence on spectra).
Spectral Libraries (cont’d) • Usually measured under laboratory conditions with excellent spectrometers. • Availability • Publicly available SLI’s are included in ENVI • ASTER speclib on the internet • Create own from field/lab measurements • Create own from image (point measurements or average of ROI)
n-Dimensional Data • Hyperspectral data (or spectra) can be thought of as points in an n-dimensional scatterplot. • The data for a given pixel corresponds to a spectral reflectance for that given pixel. • The distribution of the hyperspectral data in n-space can be used to estimate • the number of spectral endmembers and their pure spectral signatures and to help understand • the spectral characteristics of the materials which make up that signature.