Flow cytometry data handling and analysis
MARBEF Advanced Course 3-6 November 2004. Flow cytometry data handling and analysis. Gérald Grégori, Ph.D. Laboratory of Microbiology, Geochemistry, and Marine Ecology (LMGEM) Oceanographic Center of Marseille (COM)

Flow cytometry data handling and analysis
E N D
Presentation Transcript
MARBEF Advanced Course 3-6 November 2004 Flow cytometry data handling and analysis Gérald Grégori, Ph.D. Laboratory of Microbiology, Geochemistry, and Marine Ecology (LMGEM) Oceanographic Center of Marseille (COM) National Center for Scientific Research (CNRS) Campus de Luminy, Case 901, 13288 Marseille cedex 9 (France) E-mail: gregori@com.univ-mrs.fr
The content of this presentation is the exclusive property of its author. Any use is prohibited. If you wish to use any material for any purpose whatsoever, permission must be obtained from the author.
Principle of Flow Cytometry • Cells in suspension • Cells flow in single-file • Intercepted by light source(s) (laser) • Scatter light and emit fluorescence • Signal collected, filtered and • Converted to digital values • Storage on a computer Fluidics Optics Electronics Data display and analysis
Let’s start from the very beginning • Data acquisition process in flow cytometry • Comprises all the operations required to measure one or several specified characteristics of particles (cells) • Conversion of the data to a numerical form for manipulation and storage (by a computer ). • Data analysis in flow cytometry • Includes any operations used to convert measured values of the physical characteristics into information about the (biological) characteristics of some or all the particles (cells) in the sample. • Methods depend about the data acquired and about what the experimenter wants to now.
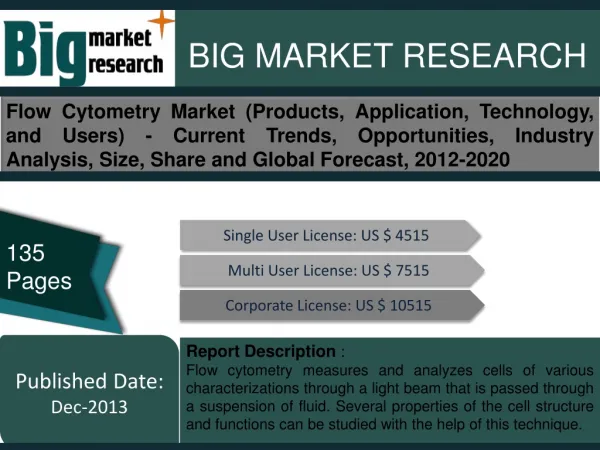
Some Flow Cytometer Companies • Advanced Analytical Technologies, Inc. (USA) • Agilent Technologies (USA) • Apogee Flow Systems (UK) • BD Biosciences (USA) • Beckman Coulter (USA) • BioDETECT AS (Norway) • Bentley Instruments (USA) • Chemunex SA (France) • CytoBuoy b.v (Netherlands) • Cytopeia (USA) • DakoCytomation (USA) • Delta Instruments bv (Netherlands) • Fluid Imaging Technologies, Inc. (USA) • FOSS Electric A/S (Denmark) • Guava Technologies, Inc. (USA) • Howard M. Shapiro, M.D., P.C. (USA) • iCyt- Visionary Bioscience (USA) • International Remote Imaging Systems (USA) • Luminex Corporation (USA) • NPE Systems, Inc. (USA) • One Lambda, Inc. (USA) • Partec GmbH (Germany) • Union Biometrica, Inc. (USA) Listed from Practical Flow Cytometry 4th Edition (H. Shapiro)
Data Format … Toward a Standard? • Need to provide a clearly defined and uniformfile format that allow data collected by one instrument to be correctly read for analysis by other software on another computer. • Data stored and saved under a Flow Cytometry Standard (.FCS) file
Structure of a FCS file • Structure in 3 or 4 segments • Header: • Identify the file as an FCS file and specify the version of FCS used • Contain numerical values identifying the position of the following TEXT segment. • Text: • Several Keywords and numerical values used to describe the sample and the experimental conditions • Data: • Numerical values in a format specified in the TEXT segment • (Analysis: Optional) • Same structure as the Text segment • Example : Results from cell cycle analysis
Example of FCS file Header FCS2.0 256 2419 8192 22640 $P1N: FS Peak $P1S: FS Peak $P1R: 1024 $P1B: 16 $P1V: 550 $P1GAIN: 15.000000 $P1PGAIN: 3.000000 @P1ADDRESS:10 $P1E: 0,0 @P1X: 0.0, 0.0 @P1U: @P1C: ARITHMETIC @P1Z: ON $P1Q: FS Peak $P2N: PMT2 Log $P2S: PMT2 Log $P2R: 1024 $P2B: 16 $P2V: 880 $P2GAIN: 5.000000 $P2PGAIN: 5.000000 @P2ADDRESS: 15 $P2E: 4.0,0.1024 @P2U: @P2C: GEOMETRIC @P2Z: ON $P2Q: PMT2 Log $DATATYPE: I $EXP: $PROJ: $INST: Purdue University Cytometry Labs $INSTADDRESS: $LOCATION: $RUNNUMBER: 964 @FILEGUID: E53F8C1E65D8D7119D9D0004 $OP: kathy $CYT: Beckman Coulter EPICS Altra $SMNO: 964 $SRC: $CELLS: $BTIM: 11:37:14 $ETIM: 11:38:15 $DATE: 27-Aug-03 @Y2KDATE: 20030827 @BASELINEOFFSET: OFF $DFC2TO1: 0.000 (…) $DFC5TO6: 0.000 @SAMPLEID1: Euglena @SAMPLEID2: @SAMPLEID3: @SAMPLEID4: @COMPENSATIONMODE: Advanced @ABSCALFACTOR: NOT SET TESTNAME: euglenaSort TESTFILE: euglenaSort @CYTOMETERID: $FIL: Euglena 00000964 002.LMD $P3N: PMT3 Log $P3S: PMT3 Log $P3R: 1024 $P3B: 16 $P3V: 740 $P3GAIN: 5.000000 $P3PGAIN: 5.000000 @P3ADDRESS:19 $P3E: 4.0,0.1024 @P3U: @P3C: GEOMETRIC @P3Z: ON $P3Q: PMT3 Log $P4N: PMT4 Log $P4S: PMT4 Log $P4R: 1024 $P4B: 16 $P4V: 796 $P4GAIN: 5.000000 $P4PGAIN: 5.000000 @P4ADDRESS: 23 $P4E: 4.0,0.1024 @P4U: @P4C: GEOMETRIC @P4Z: ON $P4Q: PMT4 Log $P5N: FS Log $P5S: FS Log $P5R: 1024 Text
Parameters (FS, RALS, Fluorescences 1st analyzed particle 2nd analyzed particle • Data • 3 formats: • List mode • Correlated • Uncorrrelated Last analyzed particle Example of FCS file (next) 119 779 541 797 669 507 784 124 800 560 842 669 417 812 223 817 574 837 730 480 805 144 795 554 807 686 458 773 134 781 551 816 675 530 800 118 806 548 816 667 388 800 109 783 563 815 668 492 803 137 768 544 793 684 433 773 113 775 521 798 658 495 776 124 782 540 804 677 524 785 153 789 540 832 686 433 797 151 686 534 649 668 619 289 (…) 117 740 522 777 656 474 745 112 805 565 839 655 489 807
Software Sources • Flow cytometer manufacturers • Commercial software sources • De Novo Software FCS Express • http://www.denovosoftware.com • Management Sciences Associates MacLAS & WinLAS • http://www.msa.com • Phoenix Flow Systems MultiCycle AV, Win-FCM, MultiTime , etc. • http://www.phnxflow.com • Ray Hicks FCSPress (Macintosh) • http://www.fcspress.com • Tree Star, Inc. FloJo • http://www.flowjo.com • Verity Software House WinList, ModFit, IsoContour • http://www.vsh.com
Non Commercial Software Sources • Autoklus (T. Bakker Schut) • http://flowcyt.cyto.purdue.edu/flowcyt/software.htm • Cylchred (T. Hoy) • http://www.uwcm.ac.uk/study/medicine/haematology/cytonetuk/documents/software.htm • CYTOWIN (D. Vaulot) • http://www.sb-roscoff.fr/Phyto/cyto.html#cytowin • Flow Explorer 4.0 (R. Hoebe) • http://wwwmc.bio.uva.nl/~hoebe/Welcome.htm • IDLK (R. Habbersett) • robb@beatrice.lanl.govj • MFI (E. Martz) • http://www.umass.edu/microbio/mfi/ • RFlowCyt (T. Rossini) • http://software.biostat.washington.edu/wikis/front/RFlowCyt • Soft Flow Hungary, Ltd. • http://www.visi.com/~soft-flow/ • WinMDI (J. Trotter) • http://facs.scripps.edu/software.html See Tutorial on your free CD-ROM
Flow Cytometry Software? What for? • Display flow cytometry data (1D, 2D, and 3D displays) • Identification of cells of interest • - Define a cluster Region • - Mixed populations and noise Gating • Characterization of cells of interest • Intrinsic parameters (mean/median scatter and fluorescence intensities ; positive/negative cells) • Cell counts (abundance) • Kinetics (evolution of a cell parameter with time) • Cell cycle analysis
Classical Data Analysis:Various types of data displays • Frequency distribution • Dot plot • Density plot • Contour plot
Frequency distribution Histograms display the distributions of the Events for one parameter. Simplicity of the plot No correlation with the other parameters Problem for cluster identification
Histogram overlay Superimpose the data from several data files
Dot plot • Displays correlated data from any two parameters. • Each dot corresponds to a particle (event) analyzed by the flow cytometer. • Several events can occupy the same dot if they have the same parameter intensities. • No indication of the relative density of the events Problem with large data files
Density and Contour plot • Density plot: • Displays two parameters as a frequency distribution. • Color is used to code the different frequencies of events. • Contour plot: • Displays correlated data from any two parameters, with contour lines joining points of equal elevation (frequency distribution). Simulation of a 3D display with a " third " parameter being the number of events. Can clarify clusters
Danger!!! • With Density plots and Contour plots some options like • Resolution • Smoothing • can emphasize or hide clusters of cells. Example : Changing Resolution 256x256 128x128 64x64
Red fluorescence Events FS LOG FS LOG RALS LOG RALS LOG 3D Displays 3 parameters displayed together 2 parameters versus density
Particle (cell) Discrimination • Problem : • Very often, samples are heterogeneous • there are events which are not of interest (other cells, debris, electronic noise). • Several clusters of interest mixed together • Solution : • Discriminate the cells of interest. • Need to exclude the unwanted events from the analysis.
What is a Region? A region can be defined as set of points carefully selected by the user that determine an area on a graph. Several regions can be defined on the same graph. • Isolate the cluster(s) of interest • Better discrimination of the cluster(s) using color
Membrane integrity Damaged membranes Compromised membranes Different styles of regions Quadrants E.coli Rectangle Polygon Green fluorescence SYBRGreen (au) Ellipse Red fluorescence Propidium iodide (au) Positive/Negative cell identification Cluster discrimination
What is a Gate? A gate can be defined as one or more regions combined using Boolean (logic) operators (AND, NOT, OR) Defines a subset of the data to be displayed. • Used to compute statistics and characterize the subset of events selected • Get rid of noise • and save space on disks
Statistics Prior the statistical analysis of the clusters, consider these two factors : 1. Sample size: The precision of the statistical analysis depends on the number of cells analyzed (Poisson Law Std Deviation = √(n) ) When the number of events increases the coefficient of variation of the estimate decreases. 2. Incorrect choiceof statistics impacts the relevance of the results.
The mean(s) The mean = one of the most widely used statistics in flow cytometry. Gives the average intensity of a parameter in a population. • Two types : • the arithmetic mean • the geometric mean. Choosing the wrong one can impact the results.
Some definitions • Arithmetic Mean (“average”) • Sum of the “n” individual values of a group divided by n Arithmetic mean =(V1 + V2 + V3 ... +Vn)/n • Geometric Mean • Multiply the “n” individual values of a cluster together and get the nth root of this product. Geometric mean = √(V1 x V2 x V3 ... xVn) n
intensity 1 64 128 192 256 1 10 100 1000 10000 1 10 100 1000 10000 256 channels 256 channels 256 channels Arithmetic mean: Arithmetic mean: Geometric mean: 13 √104 x1006 x 10002 x 100001 4x10 + 6x100 + 2x1000 + 10000x1 4x64 + 6x128 + 2x192 + 256x1 = = = 972.30 128 100 13 13 NOT display resolution dependent Display resolution dependent Sensitive to small numbers of events in the higher decades What does it mean? Linear scale Logarithmic scale
The median • Frequently used to describe flow cytometrydata. • Refers to the point at which 50% of the events are on either side of a particular channel. Example : the 2501st cell in a population of 5001. • If population normally distributed: Median = Mean =Mode • Median shifted to a higher intensity value than the mode if the population distribution is skewed to the right and shifted to a lower intensity if skewed to the left. • If data pile up in the last channel, how far off scale are they ? • Impossible to get a true mean value • Median gives a better information about the central tendency of the population • Ifmore than half the population is off-scale, then median and mean cannot give the central tendency of the population.
Other Statistics Standard Deviation (Sd) Measures the spread of a distribution = the dispersion of the values from each event around the mean of a population. Coefficient of Variation Defined as the (Standard Deviation /mean) X100. CVs are always a percentage Measure of the peak width. Mode The mode is the most frequently occurring value in a data range.If symmetrical distribution, then mode = mean = median If the distribution is skewed, then these three values are different. Skewness Characterizes the asymmetry of a distribution So it is related to the mean value of the population. If Value < 0 asymmetrical distribution tail towards the left lower values with respect to the mean. If Value > 0 tail towards the right higher values with respect to the mean. Kurtosis Kurtosis refers to the relative “flatness” of a distribution and is also related to the mean of the distribution. A Value<0 relatively flat distribution, A Value>0 a relatively peaked distribution } compared to the normal distribution
Flow Cytometry : next generation? • New technologies available for Flow Cytometry: • light sources (LEDs ; solid state lasers); • photodetectors (multichannel PMTs ; avalanche photodiodes); • Fast electronic; • Compact size; • Cheaper • New fluorescent compounds (organic dyes; nanocrystals) • New computer (faster; more memory) • More data collected per particle (cell) more Multiparametric than ever • New data types (spectra; volume; etc.)
Some examples… Eleven Colors Profiles Spectra Excitation and emission spectral bands of dyes, lines of lasers, and types of various bandpass filters necessary to perform an 11-signal analysis. CytoBuoy raw pulse data From George Dubelaar http://www.cytobuoy.com/ 32 fluorescence channels Collected for each single particle Figure from De Rosa,S.C. & Roederer,M. Eleven-color flow cytometry. A powerful tool for elucidation of the complex immune system. Clin. Lab Med. 21, 697-712, vii (2001). Purdue University Cytometry Laboratories (Lafayette, Indiana USA)
Multivariate Methodsfor multiparametric data analysis Traditionally, single and dual-parameter plots are used to visualize FCM data. Problem : For a data set defined by 7 parameters one should examine 21 of these plots!!! A more efficient solution : Reduce the dimensionality of the data Unsupervised methods such as Principal Components Analysis Fewer graphs need to be examined Supervised multivariate data analysis methods such as Artificial Neural Networks Give a prediction of the identity of the analyzed particles. Hierarchical ascendant classification Clustering more objective than manual gating
Principal Component Analysis K Parameters (variables) (FS, RALS, fluorescences) K’ Principal components 1 2 3 … K’ E1 E2 . . . En E1 E2 . . . En k ’< k Events Events • Principal Components Analysis : • Computation of new variables= Linear combination of the old ones (parameters) • The 1st new variable accounts for most of the variation (variance) in the data • The 2nd new variable accounts for the next most, and so on. • = Translation and rotation of the coordinate axes • (axes remain orthogonal to each other)
Software developed by the Example of PCA Red fluorescence (au) Red fluorescence (au) FS (au) Green fluorescence (au) Three phytoplankton cultures mixed together (Euglena, Carteria et Selenastrum) RALS (au) RALS (au) Green fluorescence (au) FS (au)
Artificial Neural Network:Kohonen Self Organizing Map (SOMs) • SOMs are "unsupervised classifier systems“ • SOMs provide a straightforward mapping of points from a “n” dimensional space (input) into a 2-dimensional space (output) Output = regular array of nodes (neurones) • Preservation of the same spatial relationships among points in the 2 spaces (topology conservation) • Input space = flow cytometric variables (parameters) • Output nodes (neurones) = the classes potentially available for the observed events (particles). The original SOMPAK suite of programs can be downloaded for free at : http://www.cis.hut.fi/nnrc/som_pak/).
i j SOMs in brief… Output layer: 2- dimensional Kohonen Competitive layer (i x j neurones) FS Fluorescence 1 (green) RALS Fluorescence 2 (orange) Fluorescence 3 (red) input layer: FCM parameters Particle
SOMs principle • A weight matrix connecting locations in the input and output spaces is calculated in a preliminary phase called “Learning phase”. • a large number of points is considered in the input space and the best mapping of those points is done in the output space (this step is repeated thousands of times) • Once this phase is completed, any new observation (particle) in the input space is directed to a specific location (classification) in the output map by means of the weight matrix
Synechococcus Fluorescent beads (1 µm) SOM Some results picoeukaryotes Prochlorococcus Red fluo. (au) RALS(au)
Conclusion • Shapiro's Seventh Law of Flow Cytometry: • “No data analysis technique can make good data out of bad data” • Practical Flow Cytometry (4th Eds; Wiley-Liss)
Short bibliography • Flow Cytometry • Shapiro, H. M. 2003. Practical Flow Cytometry - 4th ed. Alan R. Liss, Inc., New York. • Robinson J. P, Z. Darzynkiewicz, W. C. Hyun, A. Orfao, and P. S. Rabinovitch (eds.), Current Protocols in Cytometry. Wiley, J. & Sons, inc., New-York. • G. Durack and J. P. Robinson (Eds.), Emerging Tools for Single Cell Analysis: Advanced in Optical Measurement Technologies. Wiley-Liss, New York, NY, 2000 • Hoffman, R. A. 1997. Standardization, calibration, and control in flow cytometry, p. 1.3.1-1.3.19. In J. P. Robinson, Z. Darzynkiewicz, P. N. Dean, A. Orfao, P. S. Rabinovitch, C. C. Stewart, H. J. Tanke, and L. L. Wheeless (eds.), Current protocols in cytometry. John Wiley & Sons Inc., New York. • Flow Cytometry Standard Files • Cytometry 5:553-555 • Cytometry 11:323-332 • Cytometry 28:118-122 • Multiparametric Analyses • Davey, H. M., A. Jones, A. D. Shaw, and D. B. Kell. 1999. Variable selection and multivariate methods for the identification of microorganisms by flow cytometry. Cytometry 35:162-168. • Demers, S., J. Kim, P. Legendre, and L. Legendre. 1992. Analyzing multivariate flow cytometric data in aquatic sciences. Cytometry 13:291-298. • Artificial Neural Networks • Boddy, L. and C. W. Morris. 1999. Artificial neural networks for pattern recognition, p. 37-87. In A. H. Fielding (ed.), Machine learning methods for ecological applications. Kluner, Boston, Dordrecht, London. • Boddy, L., M. F. Wilkins, and C. W. Morris. 2001. Pattern recognition in flow cytometry. Cytometry 44:195-209. • Frankel,D.S., Olson,R.J., Frankel,S.L. & Chisholm,S.W. Use of a neural net computer system for analysis of flow cytometric data of phytoplankton populations. Cytometry 10, 540-550 (1989). • Kohonen, T. 1990. The Self Organizing Map. Proceedings of the IEEE 78:1464-1480. • Kohonen, T. 1995. Self Organizing Maps In Springer-Verlag (ed.), Springer Series in Information Sciences. Heidelberg. • Wilkins, M. F., L. Boddy, C. W. Morris, and R. R. Jonker. 1999. Identification of phytoplankton from flow cytometric data by using radial basis function neural networks. Applied and Environmental Microbiology 65:4404-4410.
Short bibliography (next) Flow Cytometry and Aquatic Microbiology Dubelaar, G. B. J. and R. R. Jonker. 2000. Flow cytometry as a tool for the study of phytoplankton. Scientia Marina 64:135-156. Gasol, J. M. and P. A. Del Giorgio. 2000. Using flow cytometry for counting natural planktonic bacteria and understand the structure of planktonic bacterial communities. Scientia Marina 64:197-224. Joux, F. and P. Lebaron. 2000. Use of fluorescent probes to assess physiological functions of bacteria at single-cell level. Microbes and Infection 2:1523-1535. Legendre, L., C. Courties, and M. Trousselier. 2001. Flow cytometry in oceanography 1989-1999 : environmental challenges and research trends. Cytometry 44:164-172. Nebe-Von Caron, G., P. J. Stephens, C. J. Hewitt, J. R. Powell, and R. A. Badley. 2000. Analysis of bacterial function by multicolour fluorescence flow cytometry and single cell sorting. Journal of Microbiological Methods 42:97-114. Shapiro, H. M. 2000. Microbial analysis at the single-cell level : tasks and techniques. Journal of Microbiological Methods 42:3-16. Steen, H. B. 2000. Flow cytometry of bacteria : glimpses from the past with a view to the future. Journal of Microbiological Methods 42:65-74. Vives-Rego, J., P. Lebaron, and G. Nebe-Von Caron. 2000. Current and future applications of flow cytometry in aquatic microbiology. FEMS Microbiology Reviews 24:429-448. Yentsch, C. M. and P. K. Horan. 1989. Cytometry in the aquatic sciences. Cytometry 10:497-499.