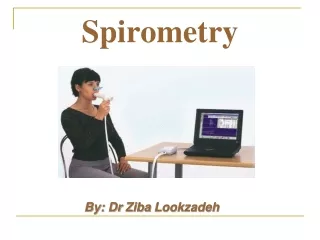
Spirometry in Primary Care
Spirometry in Primary Care. Dr Max Matonhodze FRCP (London) M A Med Ed (Keele). Objectives. Need for performing spirometry Types of spirometers Spirometric indices Obstructive spirometry and severity scale Practical tips Quality control Illustrative examples. COPD NICE guidance 2010.

Spirometry in Primary Care
E N D
Presentation Transcript
Spirometry in Primary Care Dr Max Matonhodze FRCP (London) M A Med Ed (Keele)
Objectives • Need for performing spirometry • Types of spirometers • Spirometric indices • Obstructive spirometry and severity scale • Practical tips • Quality control • Illustrative examples
COPD NICE guidance 2010 The presence of airflow obstruction should be confirmed by performing post-bronchodilator spirometry. All health professionals involved in the care of people with COPD should have access to spirometry and be competent in the interpretation of the results.
WHY? • 3 million people are estimated to have COPD in UK • 900 000 are diagnosed • 2 million are living with undiagnosed COPD • About 70% of COPD remain undiagnosed
Spirometry • Spirometry is the gold standard for COPD diagnosis • Widespread uptake has been limited by: • Concerns over technical performance of operators • Difficulty with interpretation of results • Lack of approved local training courses • Lack of evidence showing clear benefit when spirometry is incorporated into management
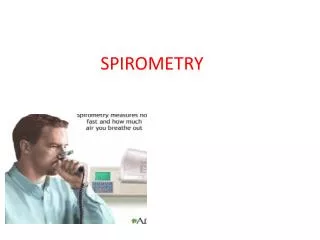
What is Spirometry? Spirometry is a method of assessing lung function by measuring the total volume of air the patient can expel from the lungs after a maximalinhalation.
Why Perform Spirometry? • Measure airflow obstruction to help make a definitive diagnosis of COPD • Confirm presence of airway obstruction • Assess severity of airflow obstruction in COPD • Detect airflow obstructionin smokers who may have few or no symptoms • Monitor disease progression in COPD • Assess one aspect of response to therapy • Assess prognosis (FEV1) in COPD • Perform pre-operative assessment
Types of Spirometers • Bellows spirometers: • Measure volume; mainly in lung function units • Electronic desk top spirometers: • Measure flow and volume with real time display • Small hand-held spirometers: • Inexpensive and quick to use but no print out
Standard Spirometric Indicies FEV1 - Forced expiratory volume in one second: The volume of air expired in the first second of the blow FVC - Forced vital capacity: The total volume of air that can be forcibly exhaled in one breath FEV1/FVCratio: The fraction of air exhaled in the first second relative to the total volume exhaled
Additional Spirometric Indicies • VC - Vital capacity: A volume of a full breath exhaled in the patient’s own time and not forced. Often slightly greater than the FVC, particularly in COPD • FEV6 – Forced expired volume in six seconds: Often approximates the FVC. Easier to perform in older and COPD patients but role in COPD diagnosis remains under investigation • MEFR– Mid-expiratory flow rates: Derived from the mid portion of the flow volume curve but is not useful for COPD diagnosis
Lung Volume Terminology Inspiratory capacity Inspiratory reserve volume Total lung capacity Tidal volume Expiratory reserve volume Residual volume
Spirogram Patterns • Normal • Obstructive • Restrictive • Mixed Obstructive and Restrictive
Predicted Normal Values Affected by: • Age • Height • Sex • Ethnic Origin
Criteria for Normal Post-bronchodilator Spirometry • FEV1: % predicted > 80% • FVC: % predicted > 80% • FEV1/FVC: > 0.7 - 0.8, depending on age
Normal Trace Showing FEV1 and FVC FVC 5 4 FEV1 = 4L FVC = 5L FEV1/FVC = 0.8 Volume, liters 3 2 1 1 2 3 4 5 6 Time, sec
SPIROMETRY OBSTRUCTIVE DISEASE
Spirometry: Obstructive Disease Normal 5 4 3 FEV1 = 1.8L FVC = 3.2L FEV1/FVC = 0.56 Volume, liters 2 Obstructive 1 1 2 3 4 5 6 Time, seconds
Diseases Associated With Airflow Obstruction COPD Asthma Bronchiectasis Cystic Fibrosis Post-tuberculosis Lung cancer (greater risk in COPD) Obliterative Bronchiolitis
Spirometric Diagnosis of COPD • COPD is confirmed by post–bronchodilator FEV1/FVC < 0.7 Plus • FEV1 %pred >80%= Mild • FEV1 %Pred 50-79% =moderate • FEV1 % Pred 30-49% =Severe • FEV1 %pred <30%= very severe
SPIROMETRY RESTRICTIVE DISEASE
Criteria: Restrictive Disease • FEV1: normal or mildly reduced • FVC: < 80% predicted • FEV1/FVC: > 0.7
Spirometry: Restrictive Disease 5 Normal 4 3 Volume, liters Restrictive FEV1 = 1.9L FVC = 2.0L FEV1/FVC = 0.95 2 1 1 2 3 4 5 6 Time, seconds
Diseases Associated with a Restrictive Defect • Extrapulmonary • Thoracic cage deformity • Obesity • Pregnancy • Neuromuscular disorders • Fibrothorax Pulmonary • Fibrosing lung diseases • Pneumoconioses • Pulmonary edema • Parenchymal lung tumors • Lobectomy or pneumonectomy
Mixed Obstructive/Restrictive • FEV1: < 80% predicted • FVC: < 80% predicted • FEV1 /FVC: < 0.7
SPIROMETRY Flow Volume
Flow Volume Curve Standard on most desk-top spirometers Adds more information than volume time curve Less understood but not too difficult to interpret Better at demonstrating mild airflow obstruction
Flow Volume Curve Maximum expiratory flow (PEF) Expiratory flow rate L/sec FVC RV TLC Inspiratory flow rate L/sec Volume (L)
Flow Volume Curve Patterns Obstructive and Restrictive Obstructive Severe obstructive Restrictive Expiratory flow rate Expiratory flow rate Expiratory flow rate Volume (L) Volume (L) Volume (L) Reduced peak flow, scooped out mid-curve Steeple pattern, reduced peak flow, rapid fall off Normal shape, normal peak flow, reduced volume
Spirometry: Abnormal Patterns Obstructive Restrictive Mixed Volume Volume Volume Time Time Time Fast rise to plateau at reduced maximum volume Slow rise to reduced maximum volume; measure static lung volumes and full PFT’s to confirm Slow rise, reduced volume expired; prolonged time to full expiration
PRACTICAL SESSION Performing Spirometry
Spirometry Training • Training is essential for operators to learn correct performance and interpretation of results • Training for competent performance of spirometry requires a minimum of 3 hours • Acquiring good spirometry performance and interpretation skills requires practice, evaluation, and review • Spirometry performance (who, when and where) should be adapted to local needs and resources • Training for spirometry should be evaluated
Obtaining Predicted Values Independent of the type of spirometer Choose values that best represent the tested population Check for appropriateness if built into the spirometer Optimally, subjects should rest 10 minutes before performing spirometry
Performing Spirometry - Preparation • Explain the purpose of the test and demonstrate the procedure • Record the patient’s age, height and gender and enter on the spirometer • Note when bronchodilator was last used • Have the patient sitting comfortably • Loosen any tight clothing • Empty the bladder beforehand if needed
Performing Spirometry Breath in until the lungs are full Hold the breath and seal the lips tightly around a clean mouthpiece Blast the air out as forcibly and fast as possible. Provide lots of encouragement! Continue blowing until the lungs feel empty
Performing Spirometry Watch the patient during the blow to assure the lips are sealed around the mouthpiece Check to determine if an adequate trace has been achieved Repeat the procedure at least twice more until ideally 3 readings within 100ml or 5% of each other are obtained
Reproducibility - Quality of Results Volume, liters Time, seconds Three times FVC within 5% or 0.15 litre (150ml)
Spirometry - Possible Side Effects • Feeling light-headed • Headache • Getting red in the face • Fainting: reduced venous return or vasovagal attack (reflex) • Transient urinary incontinence Spirometry should be avoided after recent heart attack or stroke
Spirometry - Quality Control • Most common cause of inconsistent readings is poor patient technique • Sub-optimal inspiration • Sub-maximal expiratory effort • Delay in forced expiration • Shortened expiratory time • Air leak around the mouthpiece • Subjects must be observed and encouraged throughout the procedure
Spirometry – Common Problems Inadequate or incomplete blow Lack of blast effort during exhalation Slow start to maximal effort Lips not sealed around mouthpiece Coughing during the blow Extra breath during the blow Glottic closure or obstruction of mouthpiece by tongue or teeth Poor posture – leaning forwards
Equipment Maintenance • Most spirometers need regular calibration to check accuracy • Calibration is normally performed with a 3 litre syringe • Some electronic spirometers do not require daily/weekly calibration • Good equipment cleanliness and anti-infection control are important; check instruction manual • Spirometers should be regularly serviced; check manufacturer’s recommendations
Troubleshooting Examples - Unacceptable Traces
Unacceptable Trace - Poor Effort Normal Volume, liters Variable expiratory effort Inadequate sustaining of effort May be accompanied by a slow start Time, seconds
Unacceptable Trace – Stop Early Normal Volume, liters Time, seconds
Unacceptable Trace – Slow Start Volume, liters Time, seconds
Unacceptable Trace - Coughing Normal Volume, liters Time, seconds