Download
1 / 20
200 likes | 220 Vues
This study discusses the benefits and implementation of Quasi-Least Squares (QLS) in Stata using xtgee, with a focus on analyzing interstitial cystitis in women. QLS extends GEE to handle complex correlation structures effectively. The paper outlines a two-stage procedure and programming details for applying QLS in Stata.

E N D
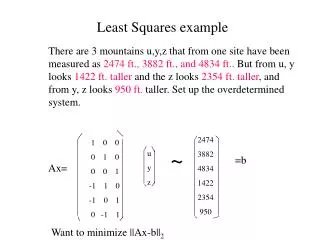
Implementation of Quasi-Least Squares using xtgee in Stata Justine Shults Assistant Professor of Biostatistics Department of Biostatistics University of Pennsylvania School of Medicine
Outline • Motivational Study -Traditional Approach (GEE) • Describe quasi-least squares (QLS) -Advantages • Implementation of QLS using xtgee • Example • Conclusion Broad Overview of Work in Progress (Papers to be submitted to Biometrics and Stata journal)
Motivational Study-Traditional approach (GEE) Study of Interstitial Cystitis (IC) in women IC is a disease of urinary tract Subjects recorded number of 24 hour voids
Timeline for a subject with all measurements: 0 months 3 months 6 months 9 months 12 months xxx xxx xxx xxx __ xxx Bout 1 Bout 2 Bout 3 Bout 4 Bout 5 Time between bouts >>>>> time within bouts
Goal of analysis: Relate covariates with expected number of 24 hour voids. • Should adjust for potential intra-subject correlation. • Traditional approach: generalized estimating equation approach (GEE) of Liang and Zeger (1986).
Limitation of GEE: Can be difficult to implement complex correlation structures. • Banded Toeplitz structure (Mazurick and Landis, Journal of Urology, 2000): • [ 1 r1 r1 r2 r2 r2 r3 r3 r3 r4 r4 r4 r5 r5 r5] • [ r1 1 r1 r2 r2 r2 r3 r3 r3 r4 r4 r4 r5 r5 r5] • [ r1 r1 1 r2 r2 r2 r3 r3 r3 r4 r4 r4 r5 r5 r5] • [ r2 r2 r2 1 r1 r1 r2 r2 r2 r3 r3 r3 r4 r4 r4] • [ r2 r2 r2 r1 1 r1 r2 r2 r2 r3 r3 r3 r4 r4 r4] • [ r2 r2 r2 r1 r1 1 r2 r2 r2 r3 r3 r3 r4 r4 r4] • [ r3 r3 r3 r2 r2 r2 1 r1 r1 r2 r2 r2 r3 r3 r3] • [ r3 r3 r3 r2 r2 r2 r1 1 r1 r2 r2 r2 r3 r3 r3] • [ r3 r3 r3 r2 r2 r2 r1 r1 1 r2 r2 r2 r3 r3 r3] • [ r4 r4 r4 r3 r3 r3 r2 r2 r2 1 r1 r1 r2 r2 r2] • [ r4 r4 r4 r3 r3 r3 r2 r2 r2 r1 1 r1 r2 r2 r2] • [ r4 r4 r4 r3 r3 r3 r2 r2 r2 r1 r1 1 r2 r2 r2] • [ r5 r5 r5 r4 r4 r4 r3 r3 r3 r2 r2 r2 1 r1 r1] • [ r5 r5 r5 r4 r4 r4 r3 r3 r3 r2 r2 r2 r1 1 r1] • [ r5 r5 r5 r4 r4 r4 r3 r3 r3 r2 r2 r2 r1 r1 1]
Allows for decline in correlation with time, but not as severe as for Markov structure • Mazurick and Landis (2000) could only implement in ad-hoc approach with GEE • Will directly implement using Quasi-Least Squares (QLS). • Developed in: Chaganty (JSPI, 1997), Shults and Chaganty (Biometrics,1998), Chaganty and Shults (JSPI, 1999)]
Advantages of QLS • In framework of GEE- extends generalized linear models for correlated data • Guarantees feasible estimates for some structures, i.e. positive definite matrix • Allows for easier implementation of some complex correlation structures • e.g. Structure appropriate for data with multiple sources of correlation. Shults, Whitt, Kumanyika (Statistics in Medicine, in press) • Banded Toeplitz structure
Two stage procedure • Based on GEE (Liang and Zeger, 1986). • Stage one: Alternates till convergence: • Estimate Β via GEE estimating equation. • Estimate p by minimizing an objective function (residuals). Solve stage one estimating equation. • Stage two: • Solve stage two equation to update estimate of p . • Obtain final estimate of Β by again solving GEE.
Implementation of QLS using xtgee Basic Idea and Outline for program: important: xtgee allows for implementation of a correlation structure that is fixed and known
Outline for program: • Let p = (r1,r2,r3,r4,r5). • To implement stage one of QLS: • Let p = 0 so that working structure = Identity. • Estimate Β by solving GEE estimating equation via xtgee, with identity correlation structure. • Repeat till convergence: • Obtain Pearson residuals. • Use algorithm based on method of bisection to solve stage one estimating equation for p. • Construct correlation matrix WORK based on updated estimate of p. • Update estimate of Β via xtgee, with correlation structure WORK treated as fixed and known.
Stage two: Use algorithm based on method of bisection to solve stage two estimating equation for p . Construct correlation matrix FINAL based on updated estimate of p. Obtain final estimate of Β via xtgee with fixed and known structure = FINAL.
Nice features of Stata: Matrix commands are helpful in setting up working structure. The xtgee procedure allows for implementation of a structure that is fixed and known. Programming, e.g. bisection method, is straightforward.
Syntax of command • Under development- programs for stats paper done, but not “tied together” • Almost identical to xtgee Simplest syntax: xtqls depvar [varlist], family(family) link(link) corr(correlation) i(varname) t(varname)
Description In Example Depvar = dependent variable 24hourvoid [varlist] = covariates age volumebladder family(family) Poisson link(link) log corr(correlation) Toepband(5,3) i(varname) subjectid t(varname) time
What is different about syntax? Will use xtqls instead of xtgee The list of possible correlation structures will be expanded. Previous list: Independent Exchangeable Autoregressive Stationary Non-stationary Unstructured User-Specified
Will add Toepband(b,v) = Toeplitz banded structure for b bouts with v visits per bout. • In future: will add additional structures.
Grant Number: 1R01CA096885-01A2 PI Name: SHULTS, JUSTINE PI Email: jshults@cceb.upenn.edu Project Title: Longitudinal Analysis for Diverse Populations Aim 5 of Abstract: ….. (5) To implement the methods for analysis (Aim 1) and planning (Aim 2) in Stata programs, for use by other statisticians. Further, to widely disseminate the programs, and their documentation, on a web site developed for this project.
Example • Estimated correlation matrix: r1 = 0.8478 r2 = 0.7165 r3 = 0.6831 r4 = 0.6653 r5 = 0.6654 This does suggest some decline, but not as severe as that indicated by a Markov structure. Note: This structure includes equicorrelated and Markov Banded as special cases.
Conclusion • QLS is based on GEE, but allows for easier implementation of some complex structures. • Nice features of Stata allow for relatively straightforward programming of QLS. • Am building xtqls procedure based on xtgee. e-mail: jshults@cceb.upenn.edu