Download
1 / 1
10 likes | 142 Vues
Background.

E N D
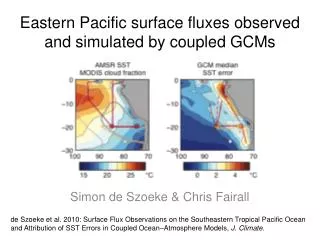
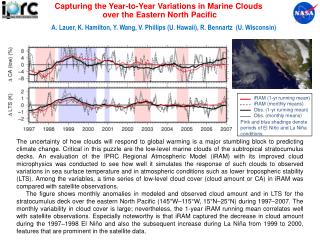
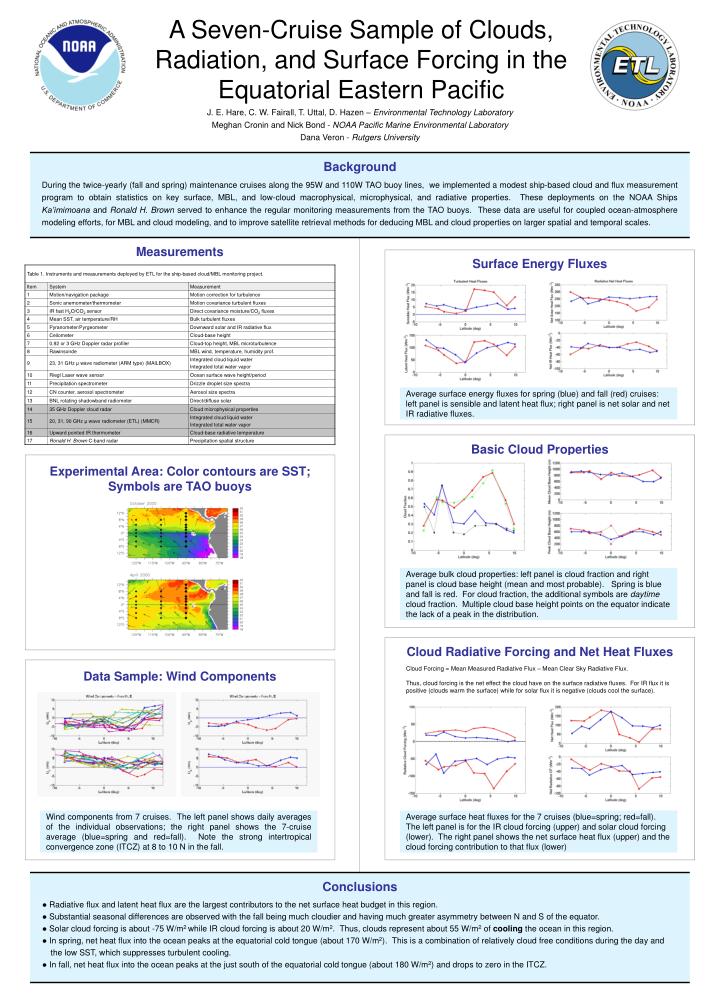
Background During the twice-yearly (fall and spring) maintenance cruises along the 95W and 110W TAO buoy lines, we implemented a modest ship-based cloud and flux measurement program to obtain statistics on key surface, MBL, and low-cloud macrophysical, microphysical, and radiative properties. These deployments on the NOAA Ships Ka’imimoana and Ronald H. Brown served to enhance the regular monitoring measurements from the TAO buoys. These data are useful for coupled ocean-atmosphere modeling efforts, for MBL and cloud modeling, and to improve satellite retrieval methods for deducing MBL and cloud properties on larger spatial and temporal scales. Surface Energy Fluxes Average surface energy fluxes for spring (blue) and fall (red) cruises: left panel is sensible and latent heat flux; right panel is net solar and net IR radiative fluxes. Basic Cloud Properties Experimental Area: Color contours are SST; Symbols are TAO buoys Average bulk cloud properties: left panel is cloud fraction and right panel is cloud base height (mean and most probable). Spring is blue and fall is red. For cloud fraction, the additional symbols are daytime cloud fraction. Multiple cloud base height points on the equator indicate the lack of a peak in the distribution. Conclusions ● Radiative flux and latent heat flux are the largest contributors to the net surface heat budget in this region. ● Substantial seasonal differences are observed with the fall being much cloudier and having much greater asymmetry between N and S of the equator. ● Solar cloud forcing is about -75 W/m2 while IR cloud forcing is about 20 W/m2. Thus, clouds represent about 55 W/m2 of cooling the ocean in this region. ● In spring, net heat flux into the ocean peaks at the equatorial cold tongue (about 170 W/m2). This is a combination of relatively cloud free conditions during the day and the low SST, which suppresses turbulent cooling. ● In fall, net heat flux into the ocean peaks at the just south of the equatorial cold tongue (about 180 W/m2) and drops to zero in the ITCZ. A Seven-Cruise Sample of Clouds, Radiation, and Surface Forcing in the Equatorial Eastern Pacific J. E. Hare, C. W. Fairall, T. Uttal, D. Hazen – Environmental Technology LaboratoryMeghan Cronin and Nick Bond - NOAA Pacific Marine Environmental LaboratoryDana Veron - Rutgers University Measurements Cloud Radiative Forcing and Net Heat Fluxes Cloud Forcing = Mean Measured Radiative Flux – Mean Clear Sky Radiative Flux. Thus, cloud forcing is the net effect the cloud have on the surface radiative fluxes. For IR flux it is positive (clouds warm the surface) while for solar flux it is negative (clouds cool the surface). Data Sample: Wind Components Wind components from 7 cruises. The left panel shows daily averages of the individual observations; the right panel shows the 7-cruise average (blue=spring and red=fall). Note the strong intertropical convergence zone (ITCZ) at 8 to 10 N in the fall. Average surface heat fluxes for the 7 cruises (blue=spring; red=fall). The left panel is for the IR cloud forcing (upper) and solar cloud forcing (lower). The right panel shows the net surface heat flux (upper) and the cloud forcing contribution to that flux (lower)