Simulation of Microbial Growth Under Fluctuating and Constant Temperatures with Excel
150 likes | 281 Vues
This guide details how to conduct microbial growth simulations using Excel under both fluctuating and constant temperature conditions, focusing on the decimal separator settings for different metric systems. Instructions for adapting numerical data inputs and running predictive models are provided, alongside steps for importing logger data and adjusting temperature settings. Key literature is referenced for further exploration of microbial behavior under varying temperatures, crucial for ensuring food safety and quality.

Simulation of Microbial Growth Under Fluctuating and Constant Temperatures with Excel
E N D
Presentation Transcript
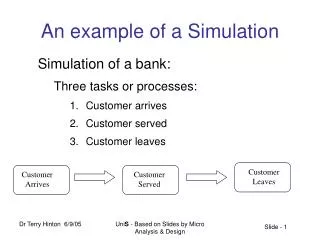
Example of simulation under fluctuating temperatures
Decimal Separators selection The metric system of some countries (Greece, Italy etc.) includes the comma (,) as a decimal separator whereas some other countries (English-speaking) use the comma to separate sequence of three digits (before the decimals). The metric system of these countries includes the period (.) as decimal separator. The decimal separator can be adapted manually to the metric system of each country by following the instructions below (Microsoft Excel 2007): Office Button/ Excel Options/Advanced/ Unclick the System separators box: In TextBox: Decimal Separator, the user can change comma (,) with period (.). In TextBox: Thousands Separator, the user can change period (.) with comma (,). By pressing OK command button, the decimal separator changes automatically.
1. Initial page 1. Define initial contamination level
2. Initial contamination level 2. Select level and press “OK” 3. Select model (Microorg.-food)
4. Select model and press “Set data to Launch area” 5. Press Return 3. Model selection
6. Import data (time-T) from loggers (XL files from your PC). Select file and press open Some delay may occur!!! 4a. Simulation under dynamic T conditions Introducing data from loggers
7. See a preview of the selected profile and approve it by pressing “Proceed” 4b. Simulation under dynamic T conditions Preview of profile
9. Press return for the main menu 9. Press return for the main menu 8. Click for graphical simulation of the model 4c. Simulation under dynamic T conditions Graphical representation of the model vs T
Example of simulation under constant temperature(s) • Two options: • 1a. Prediction for one temperature • 1b. Comparative predictions for up to 4 temperatures
1a. Steps 1-3 are common for dynamic and constant temperatures 6. Enter hours and temperature of incubation and press “OK” 4a. Simulation under constant temperature Entering hours and temperature
9. Press return for the main menu 8. Click for graphical simulation of the model 4b. Simulation under constant temperature Graphical representation of the model vs T
1b. Steps 1-3 are common for dynamic and constant temperatures 6b. For each temperature press “Go” and after all 4 temperatures press “Continue” Some delay may occur!!! 6a. Enter hours and multiple temperatures of incubation and press “OK” 4a. Simulation under constant temperature Entering hours and multiple temperatures
8. Press return for the main menu 4b. Simulation under constant temperature Graphical representation of the model vs T
LITERATURE FOR FURTHER EXPLOITATION • Bovill, R. A., Bew, J., Baranyi, J., 2001. Measurements and predictions of growth for Listeria monocytogenes and Salmonella during fluctuating temperature II. Rapidly changing temperatures. International Journal of Food Microbiology 67, 131–137. • Dalgaard, P., Buch, P., Silberg, S., 2002. Seafood Spoilage Predictor—development and distribution of a product specific application software, International Journal of Food Microbiology 73, 343– 349. • Julie E. Jones,J. E., Walker, S. J., 1993. Advances in modeling microbial growth, Journal of Industrial Microbiology 12, 200-205. • Le Marc, Y., Plowman, J., Aldus, C.F., Munoz-Cuevas, M., Baranyi, J., Peck, M.W. 2008. Modelling the growth of Clostridium perfringens during the cooling of bulk meat. International Journal of Food Microbiology 128, 41-50. • Mataragas, M., Drosinos, E. H., Vaidanis, A., Metaxopoulos, I., 2006. Development of a predictive model for spoilage of cooked cured meat products and its validation under constant and dynamic temperature storage conditions. Journal of Food Science, 71 (6), 157-167. • Microsoft, 2010. Visual Basic Developer Center. http://msdn.microsoft.com/en-us/vbasic/default.aspx (retrieved August, 2010). • McMeekin, T.A., 2007. Predictive microbiology: Quantitative science delivering quantifiable benefits to the meat industry and other food industries. Meat Science 77, 17-27.
Oscar, T.P., 2002. Development and validation of a tertiary simulation model for predicting the potential growth of Salmonella typhimurium on cooked chicken. International Journal of Food Microbiology 76, 177– 190. • Pin, C., Avendaño-Perez, G., Cosciani-Cunico, E., Gómez, N., Gounadaki, A.S., Nychas, G.-J., Skandamis, P., Barker, G. 2010. Modelling Salmonella concentration throughout the pork supply chain by considering growth and survival in fluctuating conditions of temperature, pH and aw, International Journal of Food Microbiology (in press). • Rosso, L., Lobry, J.R., Bajard, S., Flandrois, J.P. 1995. Convenient model to describe the combined effects of temperature and pH on microbial growth. Applied and Environmental Microbiology 61, 610-616. • Shepherd, R. (Ed.), 2004. Excel VBA Macro Programming, McGraw-Hill Education – Europe. • Van Impe, J., Nicolai, B.M., Martens, T., De Baerdemaeker, J., Vandewalle, J., 1992. Dynamic Mathematical Model To Predict Microbial Growth and Inactivation during Food Processing, Applied and Environmental Microbiology 58 (9), 2901-2909. • Zwietering, M.H., de Koos, J.T., Hasenack, B.E., de Wit, J.C., van’t Riet, K. 1991. Modeling of bacterial growth as a function of temperature. Applied and Environmental Microbiology 57, 1094-1101.