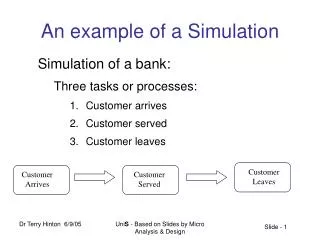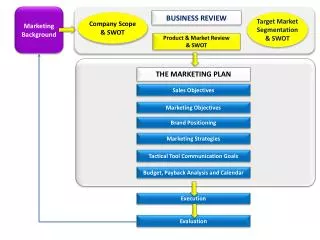
Simulation of Service Channels: The Abu and Bakar Carhop Problem
This simulation explores the dynamics of service channels at a drive-in restaurant with two carhops, Abu and Bakar. The system complexity arises from distinguishing their service rates and prioritizing customer service based on their idle times. By analyzing the arrival and service time distributions, we can compute average waiting times, idle server probabilities, and service durations. This model illustrates how to optimize service efficiency in a multi-server environment, providing insights into customer satisfaction and operational performance.

Simulation of Service Channels: The Abu and Bakar Carhop Problem
E N D
Presentation Transcript
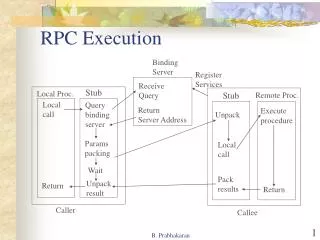
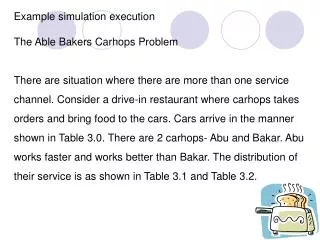
Example simulation execution The Able Bakers Carhops Problem There are situation where there are more than one service channel. Consider a drive-in restaurant where carhops takes orders and bring food to the cars. Cars arrive in the manner shown in Table 3.0. There are 2 carhops- Abu and Bakar. Abu works faster and works better than Bakar. The distribution of their service is as shown in Table 3.1 and Table 3.2.
Example simulation execution The Abu Bakar Carhops Problem Because this system has two service servers, the simulation is more complex. Because Abu is a senior, in this case a simple rule is applied. When both of them (carhops) idle then Abu will get the customer. Please take note that this condition is specifically for this drive-in restaurant and can change according to situation or other applied rules
server1 Departure Arrival queue server2 Service node Figure 3.0 Abu and Bakar Carhops node diagram
Arrival Event No Yes Server1 Busy ? Yes No Server2 Busy ? Unit enters service Figure 3.1 Arrival Event Unit enters Queue for service
Departure Event No Yes Another Unit waiting ? Remove the waiting unit from the queue Begin server idle time Begin servicing the unit Figure 3.1 Departure Event for each service station
1. Average waiting time ( minutes ) = total time customer wait in queue (minutes) total numbers of customers = = 2. Probability (wait) = Number of customers who wait total numbers of customers = =
3. Probability of idle server = total idle time of server (minutes) total run time of simulation = = 4. Average service time (minutes) for each Abu And Bakar = Total service time (minutes) total numbers of customers = =
5. Expected Service time ( minutes ) E(s) = ∞ Σ sp(s) S=0 = 6. Average time between arrivals (minutes) = Sum of all times between arrival (minutes) Number of arrivals - 1 =
7. Average waiting time of those who wait ( minutes ) = total time customer wait in queue (minutes) total numbers of customers who wait = = 8. Average time customer spends in the system = total time customer spend in system (minutes) total numbers of customers = =
Example simulation execution The newspaper Seller’s Problem: Concern on the purchase and sale of newspaper. The paper seller buys the newspaper for 33 cents each and sells them for 50 cents each. The newspaper not sold for the day will be sold as scrap for 5 cents each. Newspaper can be purchase in bundle of 10 and usually bought in bundle of 50,60 so on. Three type of newdays good, fair and poor with probabilities 0.35,0.45 and 0.20. The distribution on demand is in Table 3.4. Try to simulate demands for 20 days and recording profits for each Day.
The newspaper Seller’s Problem Profit’s formula = (Revenue from sales) – (cost of newspapers) – (Lost of profit from excess demand) + (salvage from sale of scrap papers)
A simple model Let me go through a simple example that clarifies some concepts. Suppose we wish to procure some items for a special store promotion (call them pans). We can buy these pans for RM22 and sell them for RM35. If we have any pans left after the promotion we can sell them to a discounter for RM15. If we run out of special pans, we will sell normal pans, of which we have an unlimited supply, and which cost us RM32. We must buy the special pans in advance. How many pans should we purchase?
Clearly, the answer depends on the demand. We do not know the demand that the promotion will generate. We do have enough experience in this business to have some feel for the probabilities involved. Suppose the probabilities are:
We will attack this problem through simulation. In this model, we have captured uncertainty (demand) in a single random variable. To simulate a possible demand, we will determine a random value. This returns a value between 0 and 1 with a number of nice properties: no value is more likely to occur than another, and two successive values are not correlated.
Suppose I generate the random number .78. How can I generate a demand. Simply assign each demand to a range of values proportional to its probability and determine where the .78 occurs. One possibility is: Looking at the ranges, we see the demand is 11. The demand for .35 is 10 while that for .98 is 13.
How can we use this random demand? Suppose we have decided to procure 10 pans. We could determine the total profit for each of our random demands: the profit for the first is 133, for the second is 130, and 139 for the third. Our estimate for the profit if we order 10 is $134. We could then go on to check the profit if we order a different amount. For instance, if we order 13, our profit is estimated at $162.33.
At the end, we would have a guess at the best order quantity, and an estimate of the expected profit. We would not know for certain that we made the right move, but statistical analysis can estimate how far off we might be (by the way, to get statistical significance for this problem, you need roughly 20 runs at each demand level). Note also, for this problem there is an analytic solution.