Download
1 / 20
200 likes | 377 Vues
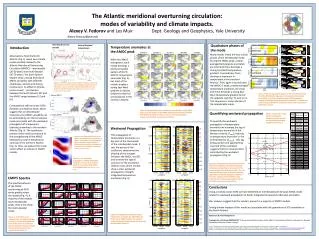
AMOC MULTI-DECADAL VARIABILITY: MECHANISMS, THEIR ROBUSTNESS, AND IMPACTS OF MODEL CONFIGURATIONS. Gokhan Danabasoglu and Steve Yeager National Center for Atmospheric Research. OUTLINE. AMOC max in CCSM3.

E N D
AMOC MULTI-DECADAL VARIABILITY: MECHANISMS, THEIR ROBUSTNESS, AND IMPACTS OF MODEL CONFIGURATIONS Gokhan Danabasoglu and Steve Yeager National Center for Atmospheric Research
OUTLINE AMOCmax in CCSM3 Many Coupled General Circulation Models (CGCMs) exhibit (multi-)decadal variability in their AMOCs. T85x1 T42x1 T31x3 • Brief review of some proposed mechanisms and their robustness • - primarily CGCM studies • - few idealized studies • - not comprehensive • Some results from the Community Climate System Model (CCSM4) to show impacts of model configuration and parameterizations on AMOC variability CONSENSUS: Density anomalies in the sinking regions of AMOC drive these AMOC fluctuations.
Proposed AMOC Variability Mechanisms Delworth et al. (1993, DMS93): GFDL R15 coupled model, 40-80 yr period weak AMOC AMOCmax vs density regressions reduced heat transport cold, dense pool in middle North Atlantic T anomalies generate cyclonic gyre circulation anomalous circulation transports S into the sinking region S, density, and AMOC all increase
DMS93 and Griffies & Tziperman (1995): Damped ocean-only mode excited by atmospheric noise Weaver & Valcke (1998): coupled mode Delworth & Greatbatch (2000): Damped ocean-only mode, continuously excited by low-frequency atmospheric forcing, implications for NAO Dai et al. (2005): Same DMS93 mechanism in PCM (25 yr) Dong & Sutton (2005): Same DMS93 mechanism in HadCM3 (25 yr) Both Dai et al. (2005) and Dong & Sutton (2005) suggest stronger ties to the NAO.
Freshwater Transport to / from Arctic Ocean and Nordic Seas Delworth et al. (1997), GFDL R15, 40-80 yr: Enhanced transport of relatively fresh water and sea ice from the Arctic via the East Greenland Current and Denmark Strait. These anomalies propagate around the subpolar gyre into the Labrador Sea, capping the convection. …. Greenland Sea oscillations are implicated, but how they are generated is unknown. Jungclaus et al. (2005), ECHAM5/MPI-OM, 70-80 yr: Storage and release of freshwater from the central Arctic to the Labrador Sea convection site along with circulation changes in the Nordic Seas due to Atlantic heat and salt transports. … Damped ocean mode excited by atmosphere as in DMS93.
Freshwater Transport to / from Arctic Ocean and Nordic Seas Oka et al. (2006), MIROC, 30-50 yr: Freshwater transport through the Denmark Strait results in deep convection see-saw between the Labrador Sea and Greenland Sea. Wind Stress / NAO changes are implicated and the variability is interpreted as a coupled mode. Winter-time mixed layer depth (m)
Danabasoglu (2008), CCSM3 T85x1 present-day control, 20 yr: March-mean boundary layer depth (BLD) EOF1 AMOCmax vs density regressions AMOC lagging AMOC leading -10 5 -5 0 10 Role for NAO m D’Orgeville & Peltier (2009), CCSM3 T31x3 pre-industrial control, 60 yr: Similar in-phase T and S contributions to density, less role for NAO, but suggest gyre – bathymetry interaction
Same Model and Integration, but 2 Different Mechanisms (HadCM3, 90 yr) Vellinga & Wu (2004): Involves large scale air-sea interaction generates cross Equatorial SST gradient AMOC + increased NHT northward ITCZ shift increased rainfall and FW flux into the ocean low salinities advected north into sinking regions surface salinity decreases AMOC -
Same Model and Integration, but 2 Different Mechanisms (HadCM3, 90 yr) Hawkins & Sutton (2007): Internal ocean mode Changes in the Nordic Seas convection lead to AMOC changes. Variations in salinity transports from the Arctic and from the North Atlantic are the main controlling feedbacks. Similar to Delworth et al. (1997) and Jungclaus et al. (2005)… but convection region, and hence the mechanism, are different.
Role for Southern Ocean Saenko et al. (2003): AMOC / NADW is affected by the Southern Ocean freshwater perturbations. Delworth & Zeng (2008), GFDL CM2.1: Strength and position of the Southern Hemisphere mid-latitude westerly winds impact AMOC strength. Biastoch et el. (2008): Dynamic signals originating in the Agulhas leakage region have influence on decadal AMOC variability. Park & Latif (2008), Kiel Climate Model: Multi-centennial and multi-decadal variabilities are both associated with sea-ice extent and the former is driven in the Southern Ocean…. Coupled ocean – atmosphere – sea-ice mode.
Some Other Mechanism Marshall et al. (2001): Intergyre gyre concept with links to NAO Msadek & Frankignoul (2009), IPSL-CM4, ~100 yr: Convection is primarily influenced by the anomalous advection of salinity due to changes in the East Atlantic Pattern… coupled mode. Zhu & Jungclaus (2008), coarse resolution ECHAM5/MPI-OM, 30 and 60 yr: They are interpreted as ocean-only and coupled modes, respectively. The 30-year variability is related to T anomalies moving along the cyclonic subpolar gyre and leading to fluctuations in horizontal density gradients and subsequent weakening and strengthening of AMOC. …. Consistent with TeRaa & Dijkstra (2002, 2003). Timmermann et al. (1998), Farneti & Vallis (2009), Cheng et al. (2004), ……………………
CCSM4 includes many physical and computational improvements in all its components compared to CCSM3. • The ocean model uses spatially and temporally varying eddy mixing coefficients, submesoscale mixing parameterization, lower horizontal viscosities, … • An overflow parameterization is used to represent the Nordic Sea overflows. • The ocean model resolution is nominal 1o in the horizontal with 60 vertical levels. No Overflows (CCSM3) With Overflows (CCSM4) Sv Sv
AMOC Maximum Transports at 26.5oN in Ocean – Ice Hindcast Simulations with CORE Forcing Impacts of surface salinity restoring Increased North Atlantic bias no restoring RAPID 4 years 1 year 1 month • Strong salinity restoring reduces model error in the subpolar seas, but it • weakens AMOC • significantly damps AMOC variability north of 30oN • reduces max Atlantic northward heat transport to below 1 PW
AMOC Properties in Ocean – Ice Hindcast Simulations AMOC maximum north of 28oN AMOC maximum at 26.5oN
AMOC Maximum Transports in CCSM4 Pre-Industrial Control Simulations CCSM4_1: 1o FV atmosphere CCSM4_2: 2o FV atmosphere 120 67 99% 95%
Impacts of Parameterized Nordic Sea Overflows on AMOC Variability Preliminary CCSM4 present-day simulations with 2o atmosphere and 1o ocean resolution AMOC maximum transport 200+ 90 70 99% 50 95% Period (years) Period (years)
Density and section-normal velocity at 45oW color: density (kg m-3) line: velocity (cm s-1)
SUMMARY – WHAT HAVE WE LEARNED IN THE LAST 5 YEARS? (CGCM view) • AMOC variability and predictability are (perhaps) more complicated than originally thought. • Proposed variability mechanisms are not (really) robust across different models. • Unresolved processes, e.g., mesoscale eddies, Nordic Sea overflows, oceanic mixing, appear to influence AMOC significantly. • AMOC variability in CCSM4 is muted compared to that of CCSM3 and preliminary results indicate influence of overflows and a different mechanism than in CCSM3. Key observational priorities listed in the AMOC 2009 report will be certainly helpful in discriminating against some of the proposed mechanisms.
Simplified Diagram of Phase Relationships in CCSM3 negative NAO positive NAO strong subpolar gyre -5 -15 -10 0 +5 min AMOC max density BLD max AMOC “max” SST • reduced sea-ice cover, • increased surface heat loss, • increased upwelling of salt • increased sea-ice cover, • reduced surface heat loss, • reduced upwelling of salt, • diffusive fluxes D’Orgeville & Peltier (2009), CCSM3 T31x3 pre-industrial control, 60 yr: Similar in-phase T and S contributions to density, less role for NAO, but suggest gyre – bathymetry interaction