Suborbital Science Program
Airborne Remote Sensing of the SF Bay NASA Ames Research Center University of California Santa Cruz Airborne Science & Technology Laboratory. San Francisco from NASA U-2 at 65,000 ft, 1972. Suborbital Science Program. Why Airborne Imagery? Spatial Resolution Comparison. 50m (AOCI from ER-2).

Suborbital Science Program
E N D
Presentation Transcript
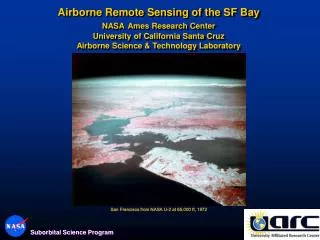
Airborne Remote Sensing of the SF Bay NASAAmes Research Center University of California Santa CruzAirborne Science & Technology Laboratory San Francisco from NASA U-2 at 65,000 ft, 1972 Suborbital Science Program
Why Airborne Imagery? Spatial Resolution Comparison 50m (AOCI from ER-2) 1Km (SeaWiFS Pixel Size) [San Diego Sewage Plume] Ames ASTL
First NASA U-2 Image of San Francisco Bay (Sept. 4, 1979) ER-2 Aircraft at low altitude
San Francisco From 65,000 ft (1972) San Francisco ER-2 AOCI Image (50 m.) Ames Research Center
San Francisco Bay Surface Temperature (ER-2 MAS Thermal Infrared, 3/27/04, 50m) Ames Research Center
Thermal Plume from Hunters Point Power Plant (C-130 NS001, c. 1984. 7 m.) Thermal IR (water) + Natural Color (land) Ames Research Center
Bair Island AreaMASTER 3/13/2000(for USGS Wetland Research Center)
AVIRIS Hyper-Spectral Data Cube of South Bay(1997, 20m) Courtesy of JPL
Extreme Low Tide, Showing SAVNASA U-2 Color Infrared Photograph, 1975(PI: Chavez, USGS)
Northern Puget Sound, Washington Eelgrass beds (Zostera Marina) Using an Airborne Thematic Mapper Simulator at Extreme Low Tide IMAGE CLASSIFICATION MAP OVERLAID ON 3-meter Ortho-rectified TMS Data NASA/EPA
The New UAV-AMS Ocean Color Imager • SeaWiFS Bands + Thermal IR for SST • Variable Resolution (2 – 50 meters) • Automatic Geo-Referencing • Highly Calibrated BandCenter Wl, nm 1 412* 2 443* 3 490* 4 510* 5 555* 6 620 7 670* 8 770* 9 860* 10 1024 11 11.5um *SeaWiFS Bands Aircraft Platforms: Altair or Global Hawk UAV, ER-2, WB-57, B200, Cessna Caravan The General Atomics Altair UAV Ames ASTL
Recent Flight Test Data From the UAV-AMS (Autonomous Modular Sensor) (April 20, 2006) Sky Research Cessna 208 Caravan (OK, not a UAV – but a lot cheaper!) AMS Spectrometer & Scan Head
Guadalupe Slough (8 m.) Natural Color Thermal IR
Dumbarton Bridge Area (8 m.) Natural Color Thermal Infrared
Richmond-San Rafael Bridge (8 m.) Thermal IR Natural Color
Stevens Creek Outlet (8 m.) Natural Color Thermal IR
Sacramento Delta - Liberty Island Levee Breach NASA AMS Sensor 4/20/06 2 m. resolution) Natural Color Sacramento Deep Water Channel Thermal IR
Sacramento River Delta Area Frank’s Tract Thermal IR (2 m.)
Towards an Integrated Sensor Web for Coastal Observations… Courtesy MBARI