Phasing
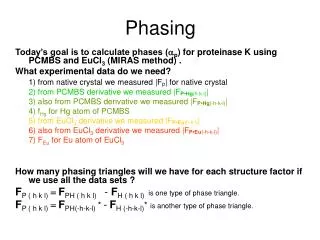
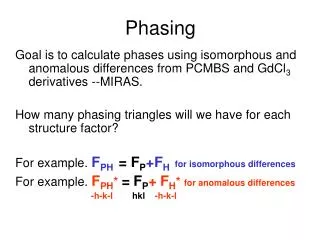
Phasing. Goal is to calculate phases using isomorphous and anomalous differences from PCMBS and GdCl 3 derivatives --MIRAS. How many phasing triangles will we have for each structure factor? For example. F PH = F P +F H for isomorphous differences

Phasing
E N D
Presentation Transcript
Phasing Goal is to calculate phases using isomorphous and anomalous differences from PCMBS and GdCl3 derivatives --MIRAS. How many phasing triangles will we have for each structure factor? For example. FPH = FP+FH for isomorphous differences For example. FPH* =FP+FH* for anomalous differences -h-k-l hkl -h-k-l
4 Phase relationships PCMBS FPH = FP+FH for isomorphous differences PCMBS FPH* =FP+FH* for anomalous differences -h-k-l hkl -h-k-l GdCl3FPH = FP+FH for isomorphous differences GdCl3 FPH* =FP+FH* for anomalous differences -h-k-l hkl -h-k-l
PCMBS FPH = FP+FH for isomorphous differences SIR Phasing Ambiguity Imaginary axis |Fp | |FPH| Real axis FH Harker construction for SIR phases. FP –native measurement FH (hkl) calculated from heavy atom position. FPH(hkl)–measured from derivative. Point to these on graph.
PCMBS FPH* =FP+FH* for anomalous differences -h-k-l hkl -h-k-l Harker Construction for SIRAS phasing (Single Isomorphous Replacement with Anomalous Scattering) Imaginary axis Isomorphous differences Anomalous differences Fp (hkl) FH(-h-k-l)* Real axis We will calculate SIRAS phases using the PCMBS Hg site. FP –native measurement FH (hkl) and FH(-h-k-l) calculated from heavy atom position. FPH(hkl) and FPH(-h-k-l) –measured from derivative. Point to these on graph. FH(hkl)
GdCl3FPH = FP+FH for isomorphous differences Harker Construction for MIRAS phasing (Multiple Isomorphous Replacement with Anomalous Scattering) Imaginary axis Isomorphous Deriv 2 Fp (hkl) Anomalous Deriv 1 Real axis Isomorphous Deriv 1
GdCl3 FPH* =FP+FH* for anomalous differences -h-k-l hkl -h-k-l Harker Construction for MIRAS phasing (Multiple Isomorphous Replacement with Anomalous Scattering) Imaginary axis Isomorphous Deriv 2 Fp (hkl) Anomalous Deriv 1 Real axis Isomorphous Deriv 1 Anomalous Deriv 2
Barriers to combining phase information from 2 derivatives • Initial Phasing with PCMBS • Calculate phases using coordinates you determined. • Refine heavy atom coordinates • Find Gd site using Cross Difference Fourier map. • Easier than Patterson methods. • Want to combine PCMBS and Gd to make MIRAS phases. • Determine handedness (P43212 or P41212 ?) • Repeat calculation above, but in P41212. • Compare map features with P43212 map to determine handedness. • Combine PCMBS and Gd sites (use correct hand of space group) for improved phases. • Density modification (solvent flattening & histogram matching) • Improves Phases • View electron density map
Center of inversion ambiguity • Remember, because the position of Hg was determined using a Patterson map there is an ambiguity in handedness. • The Patterson map has an additional center of symmetry not present in the real crystal. Therefore, both the site x,y,z and -x,-y,-z are equally consistent with Patterson peaks. • Handedness can be resolved by calculating both electron density maps and choosing the map which contains structural features of real proteins (L-amino acids, right handed a-helices). • If anomalous data is included, then one map will appear significantly better than the other. Patterson map
Use a Cross difference Fourier to resolve the handedness ambiguity With newly calculated protein phases, fP, a protein electron density map could be calculated. The amplitudes would be |FP|, the phases would be fP.r(x)=1/V*S|FP|e-2pi(hx+ky+lz-fP) Answer: If we replace the coefficients with |FPH2-FP|, the result is an electron density map corresponding to this structural feature.
r(x)=1/V*S|FPH2-FP|e-2pi(hx-fP) • What is the second heavy atom, Alex. • When the difference FPH2-FP is taken, the protein component is removed and we are left with only the contribution from the second heavy atom. • This cross difference Fourier will help us in two ways: • It will resolve the handedness ambiguity by producing a very high peak when phases are calculated in the correct hand, but only noise when phases are calculated in the incorrect hand. • It will allow us to find the position of the second heavy atom and combine this data set into our phasing. Thus improving our phases.
Phasing Procedures • Calculate phases for site x,y,z of PCMBS and run cross difference Fourier to find the Gd site. Note the height of the peak and Gd coordinates. • Negate x,y,z of PCMBS and invert the space group from P43212 to P41212. Calculate a second set of phases and run a second cross difference Fourier to find the Gd site. Compare the height of the peak with step 1. • Chose the handedness which produces the highest peak for Gd. Use the corresponding hand of space group and PCMBS, and Gd coordinates to make a combined set of phases.
Lack of closure e=(FH+FP)-(FPH) FH-calculated from atom position FP-observed FPH-observed e is the discrepancy between the heavy atom model and the actual data. Why is it not zero?
Phasing power |FH|/ e = phasing power. The bigger the better. Phasing power >1.5 excellent Phasing power =1.0 good Phasing power = 0.5 unusable e=(FH+FP)-(FPH)
Rcullis • /|FPH|-|FP|= Rcullis. • Kind of like an Rfactor for your heavy atom model. |FPH|-|FP| is like an observed FH, and e is the discrepancy between the heavy atom model and the actual data. • Rcullis <1 is useful. <0.6 great! e=(FH+FP)-(FPH)
0 + + 270 90 180 Figure of Merit 0 + + 270 90 180 0 + 270 90 + 180 Phase probability distribution How far away is the center of mass from the center of the circle?
Density modification • A) Solvent flattening. • Calculate an electron density map. • If r<threshold, -> solvent • If r>threshold -> protein • Build a mask • Set density value in solvent region to a constant (low). • Transform flattened map to structure factors • Combine modified phases with original phases. • Iterate • Histogram matching
Density modification • B) Histogram matching. • Calculate an electron density map. • Calculate the electron density distribution. It’s a histogram. How many grid points on map have an electron density falling between 0.2 and 0.3 etc? • Compare this histogram with ideal protein electron density map. • Modify electron density to resemble an ideal distribution. Number of times a particular electron density value is observed. Electron density value