Climate Change Policy: Global Frameworks and Impacts
590 likes | 671 Vues
Explore the evolution of climate science, international policies like UNFCCC and the Kyoto Protocol, greenhouse gas emissions, and regional initiatives. Understand the challenges and opportunities in combating climate change.

Climate Change Policy: Global Frameworks and Impacts
E N D
Presentation Transcript
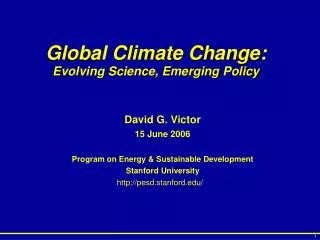
Global Climate Change:Evolving Science, Emerging Policy David G. Victor 15 June 2006 Program on Energy & Sustainable Development Stanford University
Heinrich and non-Heinrich Periods:Schematic View of Ice Flow and Sedimentation John T. Andrews, Thomas G. Andrews and Lisa M. Lixey. 2001. “Heinrich Events,” NOAA Paleoclimatology Program.
Heinrich Events(H-1, approx 15,000 years ago) John T. Andrews, Thomas G. Andrews and Lisa M. Lixey. 2001. “Heinrich Events,” NOAA Paleoclimatology Program. Photo: Bedford Institute of Oceonagraphy
Heinrich Events:“teleconnected climate” in the whole North Atlantic region? John T. Andrews, Thomas G. Andrews and Lisa M. Lixey. 2001. “Heinrich Events,” NOAA Paleoclimatology Program.
Abrupt Climate Change and Feedback Source: Reprinted from Foley, Jonathan A. (2005) “Tipping Points in the Tundra.” Science. 310: 627-8. Quirin Schiermeier, Munich. (2005) “Past climate comes into focus but warm forecast stays put.” Nature. 433: 562-3.
+8 +5 +5 +8 Paleocene-Eocene Thermal Maximum (PETM)~ 55 Mya • Extreme and rapid (~10-20 kyr) warming; ~5 to 10°C Tropic/Polar SST, +4-5°C deep sea • Elevated humidity/precipitation in mid- to high latitudes • Changes in the diversity and distribution of marine and terrestrial biota Expansion of tropical/subtropical fauna/flora into high latitudes Mass extinction Mammalian dispersal/faunal reorganization Source: James Zachos
Per-Capita Emissions of CO2 (Burning of fossil fuels and cement production, 1999) 10 9 8 7 5.5 6 metric tonnes Carbon per person 5 3.93 4 2.69 2.63 2.49 3 2.46 2.29 2.04 2 2 1.05 0.61 1 0.3 0 UK Italy USA India China Korea Japan Russia Mexico Ukraine Canada Germany Data source: Gregg Marland, Tom Boden, and Bob Andres Oak Ridge National Laboratory, University of North Dakota
International Treaties: Framework Convention System: UNFCCC • United Nations Framework Convention on Climate Change • signed in 1992 (“Earth Summit”) • Content • Avoid “…dangerous anthropogenic interference…” in the climate system • Industrialized Nations • Aim to stabilize emissions at 1990 levels • Pay into a fund to compensate developing countries • File reports • Developing Countries • Compensated with “agreed incremental cost” of compliance • File reports • All Countries Agree to Keep Talking
International Treaties: Framework Convention System: Kyoto • Treaty signed in 1997; finalized in 2001 • Basket of six greenhouse gases (not just CO2) • Emission Cuts for 38 industrialized countries • Against 1990 baseline: +10% to -8% (average: 5.2% cut) • “targets and timetables” • Applies only to 2008-2012 “budget period” • Developing countries exempt • “opt in” through Clean Development Mechanism (CDM) • “What, When and Where Flexibility”
Properties of Major Greenhouse Gases • CO2 does not have a single lifetime—some processes that remove CO2 occur rapidly; others require centuries. The values for CH4 and N20 are adjustment times • including feedbacks of emission on lifetimes. CO2 radiative forcing is for small changes from current concentrations (370 ppmv). 2050 radiative forcing calculations • are % of total anthropogenic (including ozone depletion effects) for SRES B2 scenario, total forcing in 2100 of 3.73 Wm-2. Other Scenarios do not much affect the • allocation of forcing among these gases. Source: IPCC Working Group 1. 2001. Tables 6.7 & 6.14.
Why the United States Left Kyoto: Trajectories and Kyoto Commitments
Why the United States Left Kyoto: Trajectories and Kyoto Commitments
Consequences of Allocating Permits to Countries with Different Marginal Abatement Costs:Huge Revenue Flows
900 USA 800 700 South Africa UK 600 500 grams Carbon (gC) per 1990 International Geary-Khamis dollar 400 China 300 200 Japan France India Mexico 100 Brazil 0 1800 1820 1840 1860 1880 1900 1920 1940 1960 1980 2000 2020 Carbon Intensity of Major Economies Data Source: Oak Ridge National Laboratory, Maddison, A. (2004)
Fraction of CDM Pipeline by Project Type Source: Michael Wara. (CERs supplied to Dec. 31, 2012)
Actual and Projected EU-15 GHG emissions Compared with Kyoto Target for 2008–2012, Including Kyoto Mechanisms Sources: EEA
A Fragmented Response:Emerging Carbon Currencies Sources: PointCarbon, International Emissions Trading Association
U.S. Regional Initiatives Source: www.pewclimate.org
States with GHG Reporting and Registries Source: www.pewclimate.org. As of March 2006.
States with GHG Emissions Targets Source: www.pewclimate.org. As of May 2006.
States with a Carbon Cap or Offset Requirement for Power Plants Source: www.pewclimate.org.
Renewable Portfolio Standards Source: www.pewclimate.org.
U. S. Capacity Additions… 2005 to 2010 Over 78 GW of New Capacity Source: EPRI Analysis
U. S. Capacity Additions by Year and Technology, 1999 to 2014 Capacity, MW 1999 2000 2001 2002 2003 2004 2005 2006 2007 2008 2009 2010 2011 2012 2013 2014 Source: EPRI Analysis
Number of Climate Change Related Legislative Proposals: Federal Government Congress
U.S. Energy R&D Investment Source: Reprinted from Daniel M. Kammen, Gregory F. Nemet. "Real Numbers: Reversing the Incredible Shrinking Energy R&D Budget." Issues in Science Technology, Volume 84, September, 2005.
North America Western Europe Japan and NICs China CIS Gross Expenditure on R&D (1994) India & C. Asia Scientific Output (SCI Publications, 1995) Latin America Carbon Dioxide Emissions (1998) Oceania C & E Europe SE Asia Africa Arab States 0.0% 5.0% 10.0% 15.0% 20.0% 25.0% 30.0% 35.0% 40.0% Percent of World Total Top Innovators and Emitters by World Region
AEP • “IGCC technology appears to have the greatest potential for meeting AEP’s long term goals. During the course of our evaluation, the company concluded that accelerating IGCC technology development to reach commercial availability by 2015 or before must become a high priority for AEP.” Source: AEP. “An Assessment of AEP’s Actions to Mitigate the Economic Impacts of Emissions Policies.” August 31, 2004. (http://www.aep.com/environmental/reports/shareholderreport/docs/FullReport.pdf)
AEP Ohio River Valley CO2 Storage Project - Mountaineer Plant
Southern Company: Technology and Innovation • Integrated Gasification Combined Cycle (IGCC) • Power Systems Development Facility (PSDF) • “The total plant cost for a 500-MW power plant with a subcritical steam cycle is projected to be less than $850/kW with an efficiency of almost 47 percent (HHV). Such a plant could produce electricity more economically than a natural gas combined cycle as early as 2006.” • Orlando Utilities Commission • SCR Development for high alkaline ashes • Mercury Control Research • Full-scale testing of Activated Carbon Injection • Development of a Fine Particulate Agglomerator • NuStart – Nuclear Consortium
New Ways to Burn Coal:Many Routes to Electricity Without Any CO2
Comparative Costs in 2010 Levelized Cost of Electricity, $/MWh 100 90 IGCC w/o cap 80 Wind@29% CF 70 NGCC@$6 Biomass 60 PC w/o cap 50 Nuclear 40 30 0 10 20 30 40 50 Cost of CO2, $/metric ton Source: EPRI Analysis