Download
1 / 27
280 likes | 613 Vues
LANDSLIDE SUSCEPTIBILITY MAPPING TO INFORM LANDUSE MANAGEMENT DECISIONS IN AN ALTERED CLIMATE. MUHAMMAD BARIK & JENNIFER ADAM WASHINGTON STATE UNIVERSITY . Steve Burges Retirement Symposium March 26 th , 2010. Mentoring Tips. Availability: the open door Inspiration, optimism

E N D
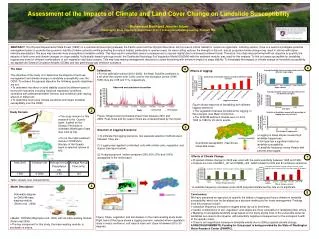
LANDSLIDE SUSCEPTIBILITY MAPPING TO INFORM LANDUSE MANAGEMENT DECISIONS IN AN ALTERED CLIMATE MUHAMMAD BARIK & JENNIFER ADAM WASHINGTON STATE UNIVERSITY Steve Burges Retirement Symposium March 26th, 2010
Mentoring Tips • Availability: the open door • Inspiration, optimism • Balancing direction and self direction • The art of questioning and listening • Being widely read and widely accepting • The initial project • Life after science • Celebration
Motivation • Land Use Change: • Logging has increased landslide frequency by 2-23 times in the Pacific Northwest (Swanson and Dyress 1975, Jakob 2000, Guthrie 2002, Montgomery et al. 2000). • Climate Change: • PNW winters are expected to become wetter; precipitation events are expected to become more extreme (Mote and Salathe 2010). • Impacts on Riparian Health: • Resulting sediment negatively affects riparian ecosystems, i.e., reduced success of spawning and rearing of salmon (Cederholm et al. 1981; Hartman et al. 1996).
Improved Forest Management Practices • Forest Management Objective • Increasing economic viability while preserving the natural environment. • “Zoned” management approach • Previous Best Management Practice Studies • Impacts on landslides are site specific • No incorporation of climate change effects into long term plans
Objective • To provide high resolution maps of the susceptibility of landslide activity to timber extraction under historical and future climate conditions. Research Questions • How is landslide activity affected by timber extraction and how does this impact vary over a range of topographic, soil, and vegetation conditions? • How will landslide susceptibility to timber extraction respond to projected climate change?
The Olympic Experimental State Forest (OESF) • “Unzoned” Management Approach Source: DNR
Model • The Distributed Hydrology Soil Vegetation Model (DHSVM) (Wigmosta et al. 1994), with a sediment module (Doten et al. 2006) was used for this study. • DHSVM mass wasting is stochastic in nature. • Infinite Slope Model • Uses Factor of Safety Approach Doten et al 2006
Model Calibration and Evaluation • Hydrologic calibration and evaluation (NS = 0.52, Volume Error = 22%; other studies looking into reasons behind poor model performance) • Evaluation of mass wasting module over sub-basins 3 2 1
Factors affecting landslide susceptibility • Factors considered: slope, soil, vegetation * The primary factors triggering harvesting-related shallow landslides (Watson et al. 1999). Watson et al. 1999
Selection of Logging Scenario • Properties changed to simulate logging: 1.Root cohesion 2.Vegetation Surcharge 3.Fractional coverage Clear-cutting done in 20-30 degree slope range.
Landslide Susceptibility Map for Historical Climate • Weighted indices calculated for each category of each class • Used to determine the susceptibility class
Comparison to actual landslides in logged areas All the polygons are harvested areas processed from 1990 Landsat-TM image. Weights were calculated for each cell on the harvested area and three susceptibility classes are created. Red marks are all historical landslides between 1990 to 1997, collected from DNR HZP inventories.
Climate change effects CGCM(B1) 2045
Climate change effects CGCM(A1B) 2045
Summary • Results indicate that 30 to 50 degree slopes range and certain types of soils (e.g. talus, sandy) are most vulnerable for logging-induced landslides. • For 2045 projected climate areas with high landslide risk increased on average 7.1% and 10.7% for B1 and A1B carbon emission scenarios, respectively. • Ongoing Work: • Model inputs and calibration • More extensive model evaluation • Isolate effects of soil and terrain factors • Isolate effects of precipitation versus temperature changes • More realistic post-logging effects • Impacts on riparian habitat
Factor of safety calculation CS = Soil cohesion Cr = Root cohesion Ф= Angle of internal friction d= Depth of soil m= Saturated depth of soil S = Surface slope q0 = Vegetable surcharge
Weight Calculation Wi= The weight given to the ith class of a particular thematic layer Npix(Si)=The number of slides pixels in a certain thematic class Npix(Ni)=The total number of pixels in a certain thematic class. n= The number of classes in the Thematic map Yin and Yan (1988), Saha et al. (2005) Weight for a particular cell W = ƩWi
Index segmentation and evaluation LSI value had the range from -3.24 to 2.21. This range was divided into three susceptibility classes based on cumulative frequency values of LSI on slide areas ( Saha et al. 2005). The breaks were done at 33 and 67%. Frequency of slides in different susceptibility classes.
Climate change scenarios Increment of slides in harvested areas for different climate change scenarios
Climate Change Effect Change in percentage of areas in different susceptibility classes for different climate change scenarios with respect to the historical scenario. For all the future climate change scenarios areas increased under the high susceptibility class.