Download
1 / 33
350 likes | 24.98k Vues
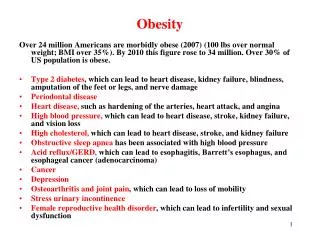
Obesity and the built environment Obesity Issues Program National Press Foundation University of Colorado at Denver. Janne Boone-Heinonen, PhD, MPH Assistant Professor of Epidemiology Oregon Health & Science University Penny Gordon-Larsen, PhD Professor of Nutrition

E N D
Obesity and the built environmentObesity Issues ProgramNational Press FoundationUniversity of Colorado at Denver Janne Boone-Heinonen, PhD, MPH Assistant Professor of Epidemiology Oregon Health & Science University Penny Gordon-Larsen, PhD Professor of Nutrition University of North Carolina at Chapel Hill April 30, 2013 Key reference Boone-Heinonen J, Gordon-Larsen P. Am J Prev Med. 2012;42(5): e37-46.
Session objectives • Conceptual framework for research on the built environment and obesity • Overview of the evidence: examples of studies on key built environment features • Diet • Physical activity • Issues to consider when evaluating built environment research Challenges of studying how the built environment effects obesity • What is on the horizon?
What is an obesogenic environment? What aspects of the environment support this… …as opposed to this?
The Built Environment “Consists of the neighborhoods, roads, buildings, food sources, and recreational facilities in which people live, work, are educated, eat, and play” • Sallis & Glanz 2006 Future Child Also known as: “neighborhood environment”, “obesogenic environment”, “physical environment”, “physical activity environment”, “food environment” Key references Sallis JF, Glanz K. Future Child. Spring 2006;16(1):89-108. Saelens BE, Sallis JF, Frank LD. Ann Behav Med. Spring 2003;25(2):80-91. Saelens BE, Handy SL. Med Sci Sports Exerc. Jul 2008;40(7 Suppl):S550-566.ç
Obesity-related policy strategies White House Task Force on Childhood Obesity (Let’s Move!) Recommendation 5.13: Increase the number of safe and accessible parks and playgrounds, particularly in underserved and low-income communities. Recommendation 4.2: Local governments should be encouraged to create incentives to attract supermarkets and grocery storesto underserved neighborhoods. Los Angeles Ordinance #180103 …prohibit the establishment of new fast food restaurants in South Los Angeles that will be effective for 365 days… White House Task Force on Childhood Obesity Report to the President: http://www.letsmove.gov/white-house-task-force-childhood-obesity-report-president LA Ordinance: http://cityplanning.lacity.org/Code_Studies/Misc/FastFoodInterim.pdf; Sturm & Cohen. Health Aff. 2009;28(6): w1088-w1097
SupermarketsA source of affordable, fresh produce? Likelihood of meeting dietary guidelines among adults with 1+ supermarkets in their neighborhood, relative to no supermarkets Photo: examiner.com ARIC Study. Census tract-defined neighborhoods. Adjusted for other types of food stores, food service plans, income, and education. Morland et al. Am J Public Health. 2002;92:1761-1767
Food deserts? • Access to Affordable and Nutritious Food – Measuring and Understanding Food Deserts and Their Consequences: Report to Congress. Administrative Publication No. (AP-036) 160 pp, June 2009 • Few households live in food deserts • Most low-income households shop for food outside their neighborhoods • Transportation barriers Food desert (USDA definition) Low‐income census tract where either a substantial number or share of residents has low access to a supermarket or large grocery store Food swamps? Prof. Donald Rose, Tulane University Access to healthy andunhealthy foods may influence diet http://www.npr.org/blogs/thesalt/2013/03/13/174112591/how-to-find-a-food-desert-near-you Map from: USDA Food Atlas
Food swampsEasyaccess to affordable, calorie dense food? Fast food restaurants Convenience stores
Fast food restaurantsA source of affordable, high calorie foods? Greater BMI in women living in areas with greater fast food restaurant density For 5’ 4” person: BMI of 29.0 = 169 pounds BMI of 29.3 = 171 pounds Women’s Health Initiative. Fast food density per 1,000 persons w/in 1.5 miles of home. Adjusted for birth cohort, race/eth, education, marital status, income, urbanicity, population density, availability of grocery stores, neighborhood SES Dubowitz et al. Obesity. 2012;20(4):862-71
Other retail food outlets of interest Farmers markets Vegetable and produce markets Small grocery stores Supercenters
Walkability/Urban sprawl Supporting walking and cycling for transportation? Suburban development, many cul-de-sacs Well-connected urban development with mixed land uses Obesity & The Environment The University of North Carolina at Chapel Hill
Example: walkability/urban sprawl Graded increase in likelihood of performing 30+ minutes/day of moderate-intensity physical activity with greater walkability index Photo: http://christophgielen.com/christoph_gielen.html SMARTTRAQ. 1-km network buffers. Adjusted for gender, age, education, ethnicity. Frank et al. Am J Prev Med. 2005;25(2S2):117-125
Recreation facilitiesSettings for exercise Greater proportion reporting physical activity 1+ times per week with greater density of recreational resources MESA. Euclidean buffers. Adjusted for gender, age, income, race/ethnicity, study site, perceived neighborhood violence. Diez Roux et al. Am J Public Health. 2007;97:493-499.
1. Why do you live where you live? Who lives on Main Street? ? Main street Walk to the store Preference to walk to the store Who lives in the suburbs? ? Suburbs Walk to the store Downtown commute Budget constraints
Do supermarkets lead to healthier diets?Another look with data that follows people over time Supermarkets Diet Quality Assess changes in diet quality related to changes in supermarket availability, analyzed in two different ways: Comparable to prior studies: expected findings Focusing on changes over time: relationship no longer apparent WHY? Complex decisions about where to live Purposeful placement of supermarkets CARDIA Study. Supermarkets per 100,000 population. Adjusted for individual-level sociodemographics and census tract-level poverty. Boone-Heinonen, et al. Arch Int Med. 2011;171(13):1162-1170
2. Does the built environment effect everyone equally? Percent increase in likelihood of meeting dietary guidelines in the presence of 1+ supermarkets in the census tract of residence (versus no supermarkets) Differences in associations are observed for numerous aspects of the food and physical activity environments ARIC Study. Adjusted for other types of food stores, food service plans, income, and education. Morland et al. Am J Public Health. 2002;92:1761-1767
3. What is a neighborhood?Consider… How far will you walk… …to the park? …for coffee? How far will you drive… …to the gym? …to the grocery store? …for a burger?
Neighborhood buffers Also: ZIP codes, Census Tracts, Census Block Groups
2 & 3. The way we should define neighborhoods may vary by gender, income, race/ethnicity, urbanicity, and others * Fast food restaurants Relationship only found in low-income men, within 2 miles of homes WHY? Why not low-income women? Why not high-income men? Why only close to home? Photo: http://trimet.org CARDIA Study. Fast food restaurants per 10,000 population. Adjusted for individual-level sociodemographics and census tract-level poverty. Boone-Heinonen, et al. Arch Int Med. 2011;171(13):1162-1170
4. What else is in your neighborhood?Teasing apart complex neighborhood environments • Density (walkability) may be important for physical activity • Many aspects captured by urbanicity • Alternative built environment measures: • Resources per 10,000 population • Resources per mile of road • Ratios of healthy/unhealthy resources
5. Many diet, physical activity, and health outcomes Fast food restaurants Supermarkets Physical activity settings
Approaches for looking at multiple diet, physical activity, and health outcomes: complex statistical modeling Fast food restaurants Supermarkets Physical activity settings
What is a “healthy” food resource? • Other features of interest • Specific type (Chipotle vs. Burger King) • Non-traditional outlets • Types of foods sold (fresh produce vs. candy) • Quality of foods sold (“fresh” vs. “not-so-fresh” fresh produce) • Affordability (“food mirage”*) Traditional convenience store Village Market (Portland, OR) Photo: Rebecca Koffman, The Oregonian *Noelle Dobson, Oregon Public Health Institute
Many steps between neighborhood availability and diet Environmental factors Individual factors Availability of supermarket Proximity Transportation Time constraints Preferences: cultural, dietary Travel to supermarket Availability In-store marketing Food placement Preferences Locate food items Select & purchase food items Affordability Quality Financial constraints Preferences Prepare food items Skills Preferences Time constraints (other neighborhood food options) Consume food items Preferences
Policy approaches to influencing dietary Intake and physical activity Adapted from Popkin BM, unpublished
Does the built environment effect ________? • Where would you rather… • Walk to dinner? • Go for a jog? • Why? • (narrow) Sidewalks • Shade • Low traffic • Parks for recreation • Cul de sacs for play • (wide) Sidewalks • Shade • Dense, diverse (short distances) • Public transportation • Limited/expensive parking
Biological & Demographic Age, sex, race/ethnicity, SES, genes Psychological Beliefs, preferences, emotions, self-efficacy, intentions, pros, cons, behavior change skills, body image, motivation, knowledge Social/Cultural Social support, modeling, family factors, social norms, cultural beliefs, acculturation Organizational Practices, programs, norms, & policies in schools, worksite, Health care settings, businesses, community orgs Physical Environment Access to & quality of foods, recreational facilities, cars, sedentary entertainment; urban design, transportation infrastructure Policies/Incentives Cost of foods, physical activities, & sedentary behaviors; incentives for behaviors; regulation of environments An Ecological Model of Diet, Physical Activity, & Obesity Influences Behaviors Health Outcomes Eating Dietary patterns, nutrient intake Sedentary Behaviors TV, computer use, driving Body Weight, Fat, & Distribution Energy Balance Physical Activity Recreation, transportation, occupation, domestic Risk Factors, CVD, Diabetes, Cancers, Costs Developed for the NHLBI Workshop: Predictors of Obesity, Weight Gain, Diet, and Physical Activity; August 2004, Bethesda MD