Obesity
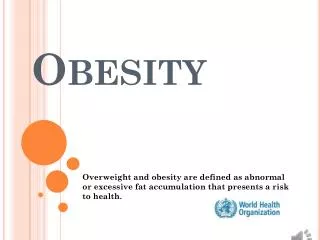
Obesity. Obesity. “Obesity is perhaps the biggest threat to the health, welfare, and future of our country.” Dr. William Dietz, CDC Obesity is a personal and public policy problem It affects everyone! Obesity is a risk factor for almost every chronic disease.

Obesity
E N D
Presentation Transcript
Obesity • “Obesity is perhaps the biggest threat to the health, welfare, and future of our country.” • Dr. William Dietz, CDC • Obesity is a personal and public policy problem • It affects everyone! • Obesity is a risk factor for almost every chronic disease.
Obesity Trends* Among U.S. AdultsBRFSS, 1985 (*BMI ≥30, or ~ 30 lbs. overweight for 5’ 4” person) No Data <10% 10%–14% CDC, 2011
Obesity Trends* Among U.S. AdultsBRFSS, 1989 (*BMI ≥30, or ~ 30 lbs. overweight for 5’ 4” person) No Data <10% 10%–14% CDC, 2011
Obesity Trends* Among U.S. AdultsBRFSS, 1993 (*BMI ≥30, or ~ 30 lbs. overweight for 5’ 4” person) No Data <10% 10%–14% 15%–19% CDC, 2011
Obesity Trends* Among U.S. AdultsBRFSS, 1997 (*BMI ≥30, or ~ 30 lbs. overweight for 5’ 4” person) No Data <10% 10%–14% 15%–19% ≥20% CDC, 2011
Obesity Trends* Among U.S. AdultsBRFSS, 2000 (*BMI ≥30, or ~ 30 lbs. overweight for 5’ 4” person) No Data <10% 10%–14% 15%–19% ≥20% CDC, 2011
Obesity Trends* Among U.S. AdultsBRFSS, 2003 (*BMI ≥30, or ~ 30 lbs. overweight for 5’ 4” person) No Data <10% 10%–14% 15%–19% 20%–24% ≥25% CDC, 2011
Obesity Trends* Among U.S. AdultsBRFSS, 2009 (*BMI ≥30, or ~ 30 lbs. overweight for 5’ 4” person) No Data <10% 10%–14% 15%–19% 20%–24% 25%–29% ≥30% CDC,2011
Contributing Factors • Portion Sizes • Physical Inactivity • Genetics • Media • Technology
Contributing Factor: Food • Energy imbalance • Is it enough to say “Eat less, exercise more?” • Humans are programmed to eat and store excess. • How is that working against us now? • Portion Sizes • Increased dramatically over the last 20 years • School Lunches • Government subsidies
(Brownell, 2006) http://www.youtube.com/watch?v=O8g3e22ycIw
Physical Inactivity • Less than 5% of adults (20+ y/o) meet guidelines for physical activity. • Schools cutting PE • Sedentary workplaces • Communities conducive to activity or exercise?
Media & Technology • “Toxic advertising” • Health claims on unhealthy foods • TV time for children & adults increased • Other media • More than 75% of Americans drive to work. • Jobs requiring physical exertion decreased • Everyday conveniences
Cholesterol • Hyperlipidemia • Elevated lipids in the blood • Hypercholesterolemia • High cholesterol (LDLs usually) • Not always due to dietary intake
Stroke • Blood supply is somehow cut off to the brain causing brain cells to die. • “Approx. 2 million brain cells die per minute during a stroke aging the brain about 3.5 years each hour.” (Insel & Roth, 2009) • Important to receive prompt treatment upon onset of symptoms.
Strokes Source: http://www.strokesurvivors.ca/new/images/stroke_diagram.gif
Strokes • Ischemic: blockage in the blood vessel • 80% of strokes are ischemic • Two types of ischemic strokes. • Thrombotic – blood clot forms in the brain • Embolic – wandering clot travels to the brain • Hemorrhagic – rupture of vessel
Strokes • ~700,000 Americans suffer a stroke every year. 1/3 will die. • Strokes may cause permanent damage • Paralysis, speech impairment, memory loss, behavior changes.
Strokes in Oregon Oregon,gov, 2010
Stroke Warning Signs Sudden numbness/weakness of face, arm, leg – especially on one side. Sudden confusion, trouble speaking or understanding. Sudden trouble seeing in one or both eyes. Sudden trouble walking, dizziness, loss of balance/coordination Sudden severe headache with no known cause.
3 question test “Give me a smile.” “Hold out your arms” “Say this for me.” Get help immediately
TransIschemic Attack (TIA) • TIA – “ministroke” • Temporary stroke like symptoms • Brief, usually only last a few minutes • No permanent damage occurs • Can be a precursor to a stroke.
Hypertension • Hypertension: arteries are narrowed, causes heart to pump harder which creates more force against the artery walls.
Hypertension • “Silent” – usually no symptoms but damage is still occurring. • Can cause damage to almost every organ in the body. Damage is irreversible. • High blood pressure: 140/90 • Can have “prehypertension”
Hypertension • Primary (essential): • 90% of all cases • Cause is unknown – probably genetics and environment. • Secondary • 10% of cases • Cause is due to medications or other diseases. • Approx. 1/3 of Americans have hypertension. • Risk increases with age.
HTN Complications • If left untreated, carries high mortality risk. • Risk factors: • Family history, race, stress, obesity, tobacco use, aging, high sodium intake • Complications: • Stroke, heart attack, heart failure, hypertensive retinopathy, renal failure
Sodium • What does sodium do for you? • Helps maintain fluid balance • Helps transmit nerve impulses • Influences contraction and relaxation of muscles
Sodium & Health • Too much sodium • Causes high blood pressure • May lead to fluid retention
Sodium Savvy The human body requires about 500 mg of sodium per day, while the average American usually ingests between 2,300-6,900 mg each day. It is recommended to stay in a range of 1,500 to 2,400 mg / day.
Where are you getting sodium? www.mayoclinic.com
Sodium & Food • On food labels: • Monosodium glutamate (MSG) • Baking soda • Baking powder • Disodium phosphate • Sodium alginate • Sodium nitrate or nitrite
Prevention • Prevent, prevent, prevent • But how???? • Individual education / motivation • Government policy • Built environments