Obesity
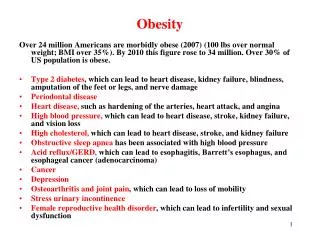
Obesity. Then and Now Why and Where How and When Will it End . Kathleen Colleran, MD Associate Professor of Medicine Medical Director, Multidisciplinary Metabolic Clinic Medical Director, Clinical Trials Center. Objectives. Understand the causes of obesity and its co-morbidities

Obesity
E N D
Presentation Transcript
Obesity Then and NowWhy and WhereHow and When Will it End Kathleen Colleran, MD Associate Professor of Medicine Medical Director, Multidisciplinary Metabolic Clinic Medical Director, Clinical Trials Center
Objectives • Understand the causes of obesity and its co-morbidities • Understand normal eating behavior and regulation and disorders leading to dysregulation of appetite regulation • Understand current and emerging obesity treatments
Class BMI (kg/m2) Health Risk Normal 20-24.9 None Overweight 25-29.9 Increased ObesityI 30-34.9 High Obesity II 35-39.9 Very high ObesityIII >40 Extremely high BMI and Health Risk
Obesity Trends* Among U.S. AdultsBRFSS, 1985 (*BMI >30, or ~ 30 lbs overweight for 5’ 4” person) No Data <10% 10%–14%
Obesity Trends* Among U.S. AdultsBRFSS, 1986 (*BMI >30, or ~ 30 lbs overweight for 5’ 4” person) No Data <10% 10%–14%
Obesity Trends* Among U.S. AdultsBRFSS, 1987 (*BMI >30, or ~ 30 lbs overweight for 5’ 4” person) No Data <10% 10%–14%
Obesity Trends* Among U.S. AdultsBRFSS, 1988 (*BMI >30, or ~ 30 lbs overweight for 5’ 4” person) No Data <10% 10%–14%
Obesity Trends* Among U.S. AdultsBRFSS, 1989 (*BMI >30, or ~ 30 lbs overweight for 5’ 4” person) No Data <10% 10%–14%
Obesity Trends* Among U.S. AdultsBRFSS, 1990 (*BMI >30, or ~ 30 lbs overweight for 5’ 4” person) No Data <10% 10%–14%
Obesity Trends* Among U.S. AdultsBRFSS, 1991 (*BMI >30, or ~ 30 lbs overweight for 5’ 4” person) No Data <10% 10%–14% 15%–19%
Obesity Trends* Among U.S. AdultsBRFSS, 1992 (*BMI >30, or ~ 30 lbs overweight for 5’ 4” person) No Data <10% 10%–14% 15%–19%
Obesity Trends* Among U.S. AdultsBRFSS, 1993 (*BMI >30, or ~ 30 lbs overweight for 5’ 4” person) No Data <10% 10%–14% 15%–19%
Obesity Trends* Among U.S. AdultsBRFSS, 1994 (*BMI >30, or ~ 30 lbs overweight for 5’ 4” person) <10% 10%–14% 15%–19%
Obesity Trends* Among U.S. AdultsBRFSS, 1995 (*BMI >30, or ~ 30 lbs overweight for 5’ 4” person) <10% 10%–14% 15%–19%
Obesity Trends* Among U.S. AdultsBRFSS, 1996 (*BMI >30, or ~ 30 lbs overweight for 5’ 4” person) <10% 10%–14% 15%–19%
Obesity Trends* Among U.S. AdultsBRFSS, 1997 (*BMI >30, or ~ 30 lbs overweight for 5’ 4” person) <10% 10%–14% 15%–19% 20%
Obesity Trends* Among U.S. AdultsBRFSS, 1998 (*BMI >30, or ~ 30 lbs overweight for 5’ 4” person) <10% 10%–14% 15%–19% 20%
Obesity Trends* Among U.S. AdultsBRFSS, 1999 (*BMI >30, or ~ 30 lbs overweight for 5’ 4” person) <10% 10%–14% 15%–19% 20%
Obesity Trends* Among U.S. AdultsBRFSS, 2000 (*BMI >30, or ~ 30 lbs overweight for 5’ 4” person) <10% 10%–14% 15%–19% 20%
Obesity Trends* Among U.S. AdultsBRFSS, 2001 (*BMI >30, or ~ 30 lbs overweight for 5’ 4” person) <10% 10%–14% 15%–19% 20%–24% 25%
Obesity Trends* Among U.S. AdultsBRFSS, 2002 (*BMI >30, or ~ 30 lbs overweight for 5’ 4” person) <10% 10%–14% 15%–19% 20%–24% 25%
Obesity Trends* Among U.S. AdultsBRFSS, 2003 (*BMI >30, or ~ 30 lbs overweight for 5’ 4” person) <10% 10%–14% 15%–19% 20%–24% 25%
Obesity Trends* Among U.S. AdultsBRFSS, 2004 (*BMI >30, or ~ 30 lbs overweight for 5’ 4” person) <10% 10%–14% 15%–19% 20%–24% ≥25%
Obesity Trends* Among U.S. AdultsBRFSS, 2005 (*BMI >30, or ~ 30 lbs overweight for 5’ 4” person) No Data <10% 10%–14% 15%–19% 20%–24% 25%–29% 30%
The Pandemic Kopelman PG; Nature 404-635-643 (2000)
Prevalence of Obesity in New Mexico Source: CDC, Behavioral Risk Factor Surveillance System, 1991-2005
If you are not outraged, youhave not been paying attention How did this happen?
140 120 100 80 60 40 20 0 Obesity in the US Overweight Obese Persons of Obestiy (millions) 1958 1978 1988 1998 2004 1968 Year Diabetes Overview. October 1995 (updated 1996). NIDDK publication NIH 96-1468.Kenny SJ et al. In: Diabetes in America. 2nd ed. 1995:47-67.
Basal Metabolic Rate Men=1kcal/hr/kg =1x24x70=1680 Women=0.9 kcal/hr/kg =0.9x24x70=1512 1 pound=3500 Kcal Energy expenditure of activity Sedentary 400-800 kcal/d Light: office 800-1200 Mod: walking, lifting 1200-1800 Heavy: const., athlete 1800-4500 Riding a century (100 miles) in under 6 hrs. burns 5000-6000 kcal Walking 3 miles/hour for 60 minutes burns 200-300 kcal The calorie facts
BAGEL 20 Years Ago Today 140 calories 3-inch diameter 350 calories 6-inch diameter Calorie Difference: 210 calories
COFFEE 20 Years Ago Coffee(with whole milk and sugar) Today Mocha Coffee(with steamed whole milk and mocha syrup) 45 calories 8 ounces 350 calories 16 ounces Calorie Difference: 305 calories
CHEESEBURGER Today 20 Years Ago 333 calories 590 calories Calorie Difference: 257 calories
FRENCH FRIES 20 Years Ago Today 210 Calories 2.4 ounces 610 Calories 6.9 ounces Calorie Difference: 400 Calories
SODA 20 Years Ago Today 85 Calories 6.5 ounces 250 Calories 20 ounces Calorie Difference: 165 Calories
SPAGHETTI AND MEATBALLS 20 Years Ago Today 500 calories 1 cup spaghetti with sauce and 3 small meatballs 1,025 calories 2 cups of pasta with sauce and 3 large meatballs Calorie Difference: 525 calories
Then Breakfast Coffee/bagel Lunch Burger/fries/coke Dinner Spagetti Total kcal=1313 Now Breakfast Coffee/bagel Lunch Burger/fries/coke Dinner Spagetti Total kcal=3,175 Then and Now Difference=1,862 kcal =½ pound =50 mile bike ride @ 18 mph or 18 mile walk @ 20 mpm
Luxury or the Latest Prison Abuse Scandal?Guantanamo Detainee Camp • 4200 calories/day • 60-90 minutes of exercise 3x/week • Underweight on arrival • Average 20 # weight increase • 1 detainee doubled his weight to 410 #s • 2 prisoners on hunger strikes remain at ideal body weight from forced feeds
Peripheral Hormones That Regulate Feeding Behavior Schwartz, MW et al; Nature 418: 595-597 (2002)
Mutations in the Leptin -Melanocortin Signaling Pathway Cummings DE et al; Annu.Rev.Med. 2003, 54:453-71
Acquired forms of Obesity • Hypercortisolism • Hypothyroidism • Hypothalamic disease • Atypical antipsychotics • HAART
While obesity is an excessive accumulation of body fat Not all fat is equal
High-Risk Obesity Phenotype:The Lifestyle Link Poirier: J Cardiopulm Rehabil, Volume 23(3).May/June 2003.161-169
What can we do? • Society • Lifestyle • Behavioral • Pharmaceuticals • Surgery • Up and coming
Life Style Strategies Talk to your patients • Size Matters-use dessert plates not dinner plates • Move forward in space • Drive by the Drive thrus • Better yet walk, jog, or cycle by the drive thrus • Diets work because they are hypocaloric • When all else fails, take drugs or • Have surgery