A B C
A B C. IC 50 (µM) MCF-7 MLET5 U0126 10.0 (0.75) 8.9 (0.4) LY294002 3.3 (0.04) 0.67 (0.01) . Supplementary Figure 2. EGFR, MAPK and AKT levels and activities in MLET lines, and growth response to specific inhibitors.

A B C
E N D
Presentation Transcript
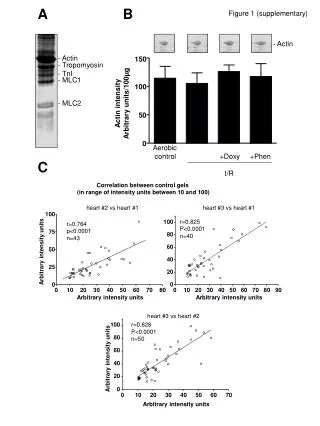
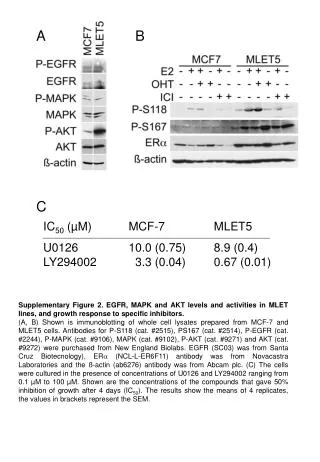
A B C IC50 (µM) MCF-7 MLET5 U0126 10.0 (0.75) 8.9 (0.4) LY294002 3.3 (0.04) 0.67 (0.01) Supplementary Figure 2. EGFR, MAPK and AKT levels and activities in MLET lines, and growth response to specific inhibitors. (A, B) Shown is immunoblotting of whole cell lysates prepared from MCF-7 and MLET5 cells. Antibodies for P-S118 (cat. #2515), PS167 (cat. #2514), P-EGFR (cat. #2244), P-MAPK (cat. #9106), MAPK (cat. #9102), P-AKT (cat. #9271) and AKT (cat. #9272) were purchased from New England Biolabs. EGFR (SC03) was from Santa Cruz Biotecnology), ERa (NCL-L-ER6F11) antibody was from Novacastra Laboratories and the ß-actin (ab6276) antibody was from Abcam plc. (C) The cells were cultured in the presence of concentrations of U0126 and LY294002 ranging from 0.1 µM to 100 µM. Shown are the concentrations of the compounds that gave 50% inhibition of growth after 4 days (IC50). The results show the means of 4 replicates, the values in brackets represent the SEM.