Download
1 / 52
520 likes | 689 Vues
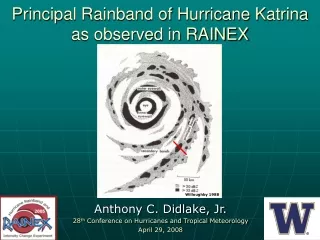
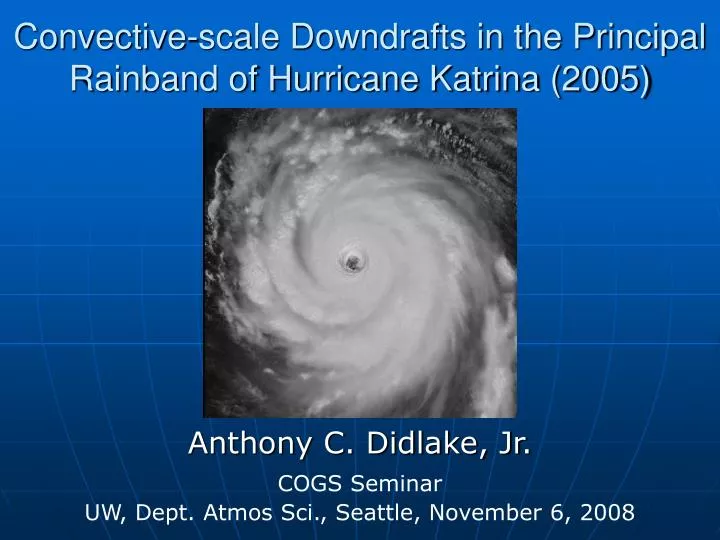
Convective-scale Downdrafts in the Principal Rainband of Hurricane Katrina (2005). Anthony C. Didlake, Jr. COGS Seminar UW, Dept. Atmos Sci., Seattle, November 6, 2008. Idealized structure of a tropical cyclone. downwind. Inner and Outer eyewalls Stationary Band Complex (SBC)

E N D
Convective-scale Downdrafts in the Principal Rainband of Hurricane Katrina (2005) Anthony C. Didlake, Jr. COGS Seminar UW, Dept. Atmos Sci., Seattle, November 6, 2008
Idealized structure of a tropical cyclone downwind • Inner and Outer eyewalls • Stationary Band Complex (SBC) • principal band • secondary bands upwind Willoughby 1988
Overview • Background and Motivation • Description of RAINEX and dataset • Methodology: Convective separation and cross sections • Characteristics of downdrafts within principal rainband • Forcing mechanisms and immediate effects of downdrafts • Possible impacts on larger tropical cyclone • Summary and conclusions
Background and Motivation • Dynamic role of principal rainband in the larger storm remains uncertain • Several modeling studies suggest the principal rainband impacts the storm intensity • PV generation and inward advection • Inhibiting inflow of warm, moist air • Formation of secondary eyewall via vortex-Rossby wave dynamics • Important to understand structure and dynamics of principal rainband, so that we may better address the difficulties in forecasting tropical cyclone intensity
Model of Principal Rainband • Convective cells embedded in stratiform rain • Overturning updraft, two downdrafts Hence and Houze 2008
Downdrafts in the Principal Rainband IED • Low-level downdraft (LLD) • Inner-edge downdraft (IED) • Forcing mechanisms, immediate effects, possible impacts on larger storm? LLD
Downdrafts in ordinary convection Zipser 1977 • Convective-scale saturated downdraft forced by precipitation drag • Mesoscale downdraft due to evaporative cooling Palmén and Newton 1969, Biggerstaff and Houze 1993, Yuter and Houze 1995 • Convective-scale downdraft forced by buoyancy pressure gradient force (BPGF) field
ELDORA data Reflectivity at 2 km
Convective/stratiform separation • Based on local gradients in reflectivity • Similar to Steiner et al. 1995, TRMM satellite data classification Convective Stratiform Weak echoNo echo
Convective pixels Stratiform pixels 2D frequency distributions Reflectivity data in % of height total
Convective pixels Stratiform pixels 2D frequency distributions Vertical velocity data in % of height total
Rainband cross sections • Radial cross sections at regular angular intervals • 0.375° 109 cross sections • Cross section coordinates based on classification
Updrafts (m s-1) Downdrafts (m s-1) Average vertical velocity Reflectivity (dBZ) as black contours LLD IED
Vertical velocity (m s-1) at 42.2° LLD analysis • Located in lower levels • Embedded in heavy precipitation Reflectivity (dBZ) as black contours
Average downdrafts (m s-1) LLD forcing mechanism • Located in lower levels • Embedded in heavy precipitation • Zipser’s “Convective-scale saturated downdraft” • Forced down by precipitation drag • Attains negative buoyancy from continuous evaporative cooling Reflectivity (dBZ) as black contours
Average downdrafts (m s-1) IED analysis • IED investigation area: 8.5 km 12.5 km
IED analysis: Downward vertical mass flux 2D distribution in kg s-1
IED analysis: Conditional probability distribution of IED speeds at 1 km • Condition: 4.5 km-IED ≤ 3 m s-1 or > 3 m s-1 • Weak mid-level IED comes with weaker low-level IED, while strong mid-level IED comes with stronger low-level IED
IED analysis: Vertical velocity at 4 km • Intermittent pattern of convective-scale updraft and downdraft cores
IED analysis: Autocorrelation of vertical velocity, Lag = 4 (≈ 4.5 km) • Physical relationship between IEDs and updrafts
Reflectivity (dBZ) at 35.8° IED forcing mechanism • Originates above the melting level, outside of heavy precipitation • Occurs on the convective scale, rather than mesoscale Overlaid by in-plane wind vectors
Vertical velocity (m s-1) at 35.8° IED forcing mechanism • Originates above the melting level, outside of heavy precipitation • Occurs on the convective scale, rather than mesoscale • Initially forced by the BPGF created by the updraft Reflectivity (dBZ) as black contours
Reflectivity (dBZ) at 35.8° IED forcing mechanisms • Initially forced by the BPGF created by the updraft 2-step process!
Reflectivity (dBZ) at 35.8° IED forcing mechanisms • Initially forced by the BPGF created by the updraft • Attains negative buoyancy by evaporating heavy precipitation of rainband 2-step process!
IED effects: Sharp inner-edge reflectivity gradient
Reflectivity (dBZ) at 35.8° IED effects: Sharp inner-edge reflectivity gradient
Tangential wind speed (m s-1) at 35.8° IED effects: Low-level wind maximum (LLWM)
Tangential wind speed Vertical velocity Vertical vorticity Divergence
Composite tangential wind speed from Hurricane Floyd (1981) Tangential wind speed (m s-1) at 35.8° Possible impacts: Increased inward flux of angular momentum • LLWM lies in radial inflow • Increased angular momentum results in stronger vortex Barnes et al. 1983
Commonly observed features of principal rainband • Upwind end consists of newer, robust convective cells • Downwind end consists of older cells collapsing into stratiform precipitation • Principal rainband is often stationary relative to the storm center Hence and Houze 2008 Barnes et al. 1983
Vertical velocity at 42.2° Possible impacts: Growth and sustenance of principal rainband • Area of divergence near surface under LLD • Preferred region of convergence on upwind side of LLD core • Growth of updraft on upwind end of rainband Divergence Convergence LLD Background flow Plan view
Possible impacts: Growth and sustenance of principal rainband • Tropical storm Ophelia (2005) • Operational radar from Melbourne, FL • Discrete propagation of vertical velocity cores, rainband cells • Stationary rainband relative to storm center Radar loop
Conclusions • Principal rainband contains two repeatable convective-scale downdrafts • Low-level downdraft is forced by precipitation drag beneath heavy precipitation • Inner-edge downdraft is initially forced by pressure perturbations created by nearby buoyant updrafts, then evaporative cooling • Vorticity dynamics of updraft and IED create a low-level wind maximum that leads to increased angular momentum of storm • Interaction between updraft and two downdrafts leads to growing and sustaining convection of principal rainband • Convective-scale features allow principal rainband to continue its impact on the overall storm
Future Work • Analyze convective-scale structures in high-resolution model output from RAINEX • Investigate outer rainbands and compare to inner core of storm
Acknowledgments • Bob Houze • Deanna Hence, Stacy Brodzik • Brad Smull, Tomislav Maric, Jian Yuan, Mesoscale Group • Michael Bell, Sandra Yuter • Beth Tully • Atmos Grad 2006
Convective/stratiform classification • Technique used in Steiner et al. 1995, Yuter and Houze 1997, Yuter et al. 2005 • Algorithm separates convective regions from stratiform regions by comparing local reflectivity to background reflectivity • Tuning of algorithm required to recognize convective regions; the rest is designated as stratiform
Convective/stratiform classification • Convective center if: • Z Zti • Z-Zbg Zcc(Zbg) • Classified convective within R(Zbg) from convective center, remaining is classified stratiform (unless Z < Zwe) Zti= 45 dbZ; Zwe= 20 dbZ; R = 0.5+.23(Zbg-20); Rbg= 11 km; a=9; b=45
Statistical significance testing • Two-sided Student’s t statistic • Significance level of 95% • Null hypothesis that true autocorrelation is zero • Number of independent samples determined by formula of Bretherton et al. (1999)