Science Quiz on Energy, Tides, Ecology, and Freshwater Sources
This quiz assesses knowledge on various science concepts such as energy, tidal influences, predator-prey relationships, and sources of freshwater. Students are challenged to answer questions about the position of celestial bodies affecting tides, the complexity of biological terms, and the distribution of Earth's freshwater. Additionally, it includes comprehension of relationships in ecological systems and analysis of data through graphs and tables. Perfect for testing your understanding of Earth Science!


Science Quiz on Energy, Tides, Ecology, and Freshwater Sources
E N D
Presentation Transcript
Bellringer week 9 Please remember to write your Full name, teacher’s name and student number in the upper right hand corner of your paper=)
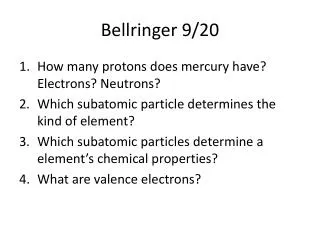
Question 1 and 2 1. Energy is the ability to do ______ or cause _________ 2. Which of these has the greatest influence on the tides of Earth’s oceans? A the position of the moon B the position of other planets C the position of the sun D the position of the stars
Question 3 & 4 3. Which of these terms are listed in order of increasing complexity? A organism, cell, organ, organ system B cell, organ system, organism, organ C organ, cell, organ system, organism D cell, organ, organ system, organism 4. Which of these is a predator-prey relationship? A elk—quail B polar bear—seal C rabbit—grasshopper D bear—mountain lion
Question 5 & 6 5. Where can most of the fresh water on Earth be found? A in the ocean B in rivers and lakes C in underground aquifers D in glaciers and the polar icecaps 6. Which of these scientific ideas from centuries ago is still true today? A Earth and the moon attract each other. B Gold can be made from other metals. C Earth is the center of the solar system. D The surface of Earth is flat.
Question 7 & 8 7.Where can most of the fresh water on Earth be found? A in the ocean B in rivers and lakes C in underground aquifers D in glaciers and the polar icecaps 8. Which of these is the best example of a new material that has chemical and physical properties that are different from the materials from which it is made? A gold B saltwater C air D concrete
Question 9 Look at the graph. Thirty students took the quiz. The graph shows how many students received the grades A, B, C, and F. How many students received a grade of D on the quiz? A 4 students B 7 students C 10 students D 13 students
Question 10 Look at the data table showing the speed of a toy car in five repeated trials of an investigation. What is the mean speed of the toy car in the investigation? A 2.5 m/sec B 12.5 m/sec C 2.7 m/sec D 2.9 m/sec
Question 11- BONUS!! Using the diagram below, which letter represents summer in the Northern Hemisphere? B A C D