Science Bellringer Questions for Week 8
This resource provides a set of thought-provoking science bellringer questions for Week 8 of your curriculum. Students are prompted to answer questions related to plant cells, technology, the metric system, energy, motion, ecological systems, and data representation. Designed to stimulate critical thinking and reinforce scientific concepts, this exercise encourages learners to explore topics like ecosystems, the nervous system, and data visualization effectively. Make sure to write your name, teacher’s name, date, and "Bellringer Week 8" in the upper right corner.


Science Bellringer Questions for Week 8
E N D
Presentation Transcript
Bellringer week 8 Remember to write your name, teacher’s name , date and bellringer week 8 in the upper right hand corner of your paper.
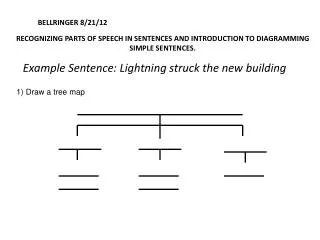
Question 1& 2 • 1.Which of these tools would be best for studying plant cells? A a hand lens B a microscope C a telescope D binoculars 2. Technology may not provide the best solution for A judging what is beautiful B forecasting the weather C communication over long distances D keeping home temperatures constant
Question 3 & 4 3. The metric system is a system based on what number? 4. Light is an example of A force B energy C matter D heat
Question 5 The graph shows the motion of a car traveling through town: How much time did it take the car to travel 200 meters? A 10 seconds B 20 seconds C 30 seconds D 40 seconds
Question 6 & 7 6. The energy that producers in most ecosystems use to make food comes from A. minerals in the soil B light from the sun C gas from the air D water in the soil 7. Which of these organisms can not be classified as a plant or animal? A a slug B a fern C a jellyfish D a mushroom
Question 8 & 9 8. Which of these systems is responsible for a person feeling pain? A the nervous system B the skeletal system C the respiratory system D the muscular system 9. Which of these locations would still remain mostly unexplored without special technologies? A the ocean floor B riverbeds C mountains D fresh water lakes
Question 10 A student counted the number of bees on different colors of flowers in a garden. There were 2 bees on white flowers, 4 bees on red flowers, 6 bees on yellow flowers, and 9 bees on blue flowers. • Which graph would be the best way to correctly show this data? A C D B