Download

1 / 50
500 likes | 700 Vues
PROJECT TEMPEST. The Comparative Analysis of Airflow Around a Rocket. Part I: Vehicle. March 21 Second test flight of full-scale vehicle April 12 Rocket ready for launch April 16 Rocket Fair/Hardware & Safety check April 19 SLI Launch Day. Major Milestone Schedule.

E N D
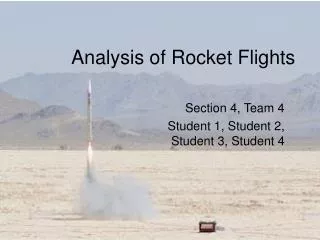
PROJECT TEMPEST The Comparative Analysis of Airflow Around a Rocket
March 21 Second test flight of full-scalevehicle April 12 Rocket ready for launch April 16 Rocket Fair/Hardware & Safety check April 19 SLI Launch Day Major Milestone Schedule
Flight Sequence • First stage burn • Stage separation. • Booster coasts to its apogee and deploys main parachute. • Booster lands safely • Second stage motor burn • Sustainer reaches apogee, deploys drogue parachute • Sustainer descends under drogue parachute to 700ft • Main parachute deploys, slowing rocket to safe landing speed of 15-20 fps. • Sustainer lands safely.
Stable launch of the vehicle Target altitude of one mile reached Smooth stage separation. Proper deployment of all parachutes Safe recovery of the booster and the sustainer Success Criteria
Entire Rocket • CP 118.8” (from nosetip) • CG101.8” (from nosetip) • Static Margin 4.23 calibers Length 156.5” Diameter 6” Liftoff weight 37.4 lb. Motor K1275 Redline (54mm)
Sustainer • CP 83.8” (from nosetip) • CG 63.6” (from nosetip) • Static Margin 5.04 calibers Length 94” Diameter 4” Liftoff weight 12.7 lb. Motor J380 Smokey Sam (54mm)
Fins: 1/32” G10 fiberglass + 1/8” balsa sandwich Body: fiberglass tubing, fiberglass couplers Bulkheads: 1/2”plywood Motor Mount: 54mm phenolic tubing, 1/2” plywood centering rings Nosecone: commercially made plastic nosecone Rail Buttons: large size nylon buttons Motor Retention system: Aeropack screw-on motor retainer Anchors: 1/4” stainless steel U-Bolts Epoxy: West System with appropriate fillers Construction Materials
Wp - ejection charge weight in pounds. dP - ejection charge pressure, 15psi V - free volume in cubic inches. R - combustion gas constant, 22.16 ft- lbf/lbm R for FFFF black powder. T - combustion gas temperature, 3307 degrees R Ejection Charge Calculations Wp = dP * V / (R * T)
Calculated Ejection Charges Ejection charges have been verified using static testing.
Tested Components C1: Body (including construction techniques) C2: Altimeter C3: Data Acquisition System (custom computer board and sensors) C4: Parachutes C5: Fins C6: Payload C7: Ejection charges C8: Launch system C9: Motor mount C10: Beacons C11: Shock cords and anchors C12: Rocket stability C13: Second stage separation and ignition electronics/charges Verification Matrix
Verification Tests V1 Integrity Test: applying force to verify durability. V2 Parachute Drop Test: testing parachute functionality. V3 Tension Test: applying force to the parachute shock cords to test durability V4 Prototype Flight: testing the feasibility of the vehicle with a scale model. V5 Functionality Test: test of basic functionality of a device on the ground V6 Altimeter Ground Test: place the altimeter in a closed container and decrease air pressure to simulate altitude changes. Verify that both the apogee and preset altitude events fire. (Estes igniters or low resistance bulbs can be used for verification). V7 Electronic Deployment Test: test to determine if the electronics can ignite the deployment charges. V8 Ejection Test: test that the deployment charges have the right amount of force to cause parachute deployment and/or planned component separation. V9 Computer Simulation: use RockSim to predict the behavior of the launch vehicle. V10 Integration Test: ensure that the payload fits smoothly and snuggly into the vehicle, and is robust enough to withstand flight stresses. Verification Matrix
Liftoff Weight: 34 lbs Motor: Booster K1100 T Sustainer I599N Length: 157 inches Diameter: 6in Stability Margin: Booster 4.53 Sustainer 5.88 Vehicle Parameters
Test dual deployment avionics Test full deployment scheme Test validity of simulation results Test rocket stability Test staging scheme Flight Objectives
Apogee: 2519 ft RockSim Prediction: 2479 ft Time to apogee: 12 seconds Apogee events: drogue Sustainer main parachute: 700 ft Sustainer Flight Results
Sustainer Flight Data Sustainer True Apogee Apogee Events Sustainer Main Parachute Deployment Booster Apogee Temporary Altimeter #2 Power Failure
Flight Simulations vs. Data Apogee = 2519ft Recorded data Simulation results (updated CD) Apogee = 2479ft
Experiment Concept • We will use an array of pressure sensors to observe the airflow characteristics around several obstacles during a two stage flight. • After flight, we will test the rocket in a wind tunnel and compare the results.
Experiment Concept Artificial protrusions (obstacles) will be placed on the sustainer body to create disturbances in airflow. Airflow Pressure sensors will measure the local pressure before and after the protrusions
Payload Sequence The sequence of our payload as it goes from flight to the final report.
Payload Objectives • Determine the effect of obstacles on the surface of rocket on airflow around the rocket • Determine the accuracy of wind tunnel testing
Payload Success Criteria • Obstacles remain attached to the rocket during flight. • Sensors will successfully collect and store measureable data during flight. • Data collected is reliable and accurate.
Data Acquisition The payload will measure the airflow around the rocket using an array of pressure sensors. The location of the pressure sensors are shown in red and obstacles are shown in blue.
Data Acquisition Sampling rate: 100 times per second Sampling resolution: 16 bits (2 LSB noise expected) 100kPa full scale range (15kPa ~ 115kPa) Sampling locations: 12 on sustainer and 12 on booster
Data connections Each data acquisition board (DAB) reads and stores data from 6 pressure sensors Analog signals from the sensors are carried to the digitizer (ADC) using a shielded cable All DABs in the same stage are activated by the same G-switch shielded cable Data acquisition sensor Common G-switch
Electronics Data Acquisition Board: controls signal digitization, receives and stores digitized data from pressure sensors Sensor Board: hosts a single pressure sensor and signal conditioning (noise suppression) circuitry Electrical schematics for DAB: shows the components and connections between them
Integration Plan Sensor package Fin Tab • Fin • Parachute • Data Processing and Storage • Motor
Sustainer DPS Unit Timer Alt Diagram of the sustainer showing the payload integration. Parachute Compartment Sensor package
Booster Fin Fin Tab DPS&S Parachute Motor Alt Alt Diagram of the Booster showing the payload integration. Parachute Compartment
Variables • Independent Variables • Type and location of obstacles………….…. L • Air density outside of rocket……..……..…. D • Speed of air flow…………………………………. S • Air pressure………………………………………… P • Acceleration profile…………………………….. X,Y,Z • Dependent Variables • Pressure at each sensor………….………….. Yi
Controls • Identical rocket in wind tunnel and actual flight • Identical obstacles on rocket in wind tunnel and actual flight • Similar wind speeds in wind tunnel and actual flight of first stage • Identical sensors and method of data storage
Correlations • Primary correlations • Yx = f(L)(local pressure vs. location) • Yx = f(S)(local pressure vs. airspeed) • Data from wind tunnel test and actual flight will be compared • Further correlations from actual flight • pressure vs. selected independent variables
Verification Matrix Verification Tests Drop Test Connection and Basic Functionality Test Pressure Sensor Test Scale Model Flight Durability Test Acceleration Test Battery Capacity Test Components Pressure Sensors Battery Pack Altimeter 3D Accelerometer Obstacles
Relevance of Data, Accuracy and Error Analysis Simulated pressure profile at 100mph Predicted pressure changes: -400Pa .. +300Pa
Relevance of Data, Accuracy and Error Analysis Simulated pressure profile at 250mph Predicted pressure changes: -2,000Pa .. +1,500Pa Simulated pressure profile at 250mph
Relevance of Data, Accuracy and Error Analysis Resolution: true 14 bit (16 bit digitization with 2 LSB noise) 14 bits = 16,384 signal levels Sensor range: 100,000Pa (15,000 – 115,000Pa) 100,000Pa / 16,384 levels = 6.10Pa / level Expected pressure differences: @ 100mph: -400Pa ~ +300Pa 114 levels @ 250mph: -2,000Pa ~ +1,500Pa 573 levels