Enhancing Data Understanding through 3D Visualization Techniques and Sculptural Elements
This text discusses the benefits of using 3D visualization in data representation. It emphasizes techniques such as highlighting, drop shadows, and figure-ground separation to distinguish features effectively. The importance of interpreting data in a 3D context is illustrated through various examples, including virtual models and interactive controls. Additionally, it explores the challenges of visualizing complex data and presents solutions such as translucence, movement, and user engagement to enhance comprehension and affordance in understanding abstract concepts.


Enhancing Data Understanding through 3D Visualization Techniques and Sculptural Elements
E N D
Presentation Transcript
“sculptural” window elements • highlighting • drop shadows • may help distinguish features– figure ground separation – e.g. X Motif – everything in sculpture! • improve affordances– buttons are for pushing
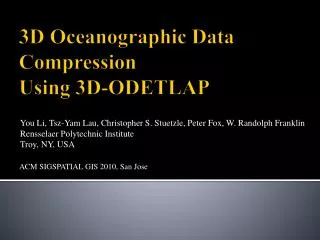
3D data visualisation • arbitrary parametrisation • e.g. height weight lifespan • build on 2D features • e.g. country car production • N.B. volume or height! • map to real 3D world features • e.g. virtual wind tunnel
3D graphs for non 3D data • 3D histograms etc. • may be misleading (3Dpie charts!) • hard to see 3D for static pictures • use colour as redundant cue • use movement • allow user controlled rotation etc.
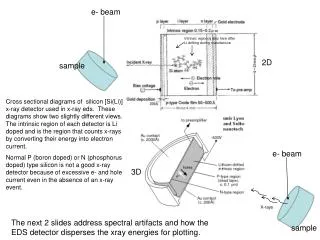
real 3 D data • scalar data • temperature, density, pressure • vector data • wind flows, electromagnetic fields
seeing inside? • Problem - we only see the surface • Solution - reduce ‘density’ of data • points OK (stars) - show samples only • translucence • slices • lines
seeing inside - use interaction! • move in the environment • look around the back! • manipulate things • pick up, open up • control cuts, density etc. • e.g. virtual human • insert markers • virtual bubbles, smoke
information visualisation • abstract data • use 3D to increase virtual space • humans understand physical world
Temporal fusion • moving changing images • successive images • parallel changes