Download
1 / 11
110 likes | 230 Vues
Solvent VOC Emissions for the European Union. John Pearson & Antoine Brossier European Solvents Industry Group April 2013. ACCURATE SOLVENTS INVENTORIES. IN 2012 ESIG OBTAINED SOLVENT VOC DATA FOR EACH EU COUNTRY FOR 2008 and 2009

E N D
Solvent VOC Emissionsfor the European Union John Pearson & Antoine Brossier European Solvents Industry Group April 2013
ACCURATE SOLVENTS INVENTORIES • IN 2012 ESIG OBTAINED SOLVENT VOC DATA FOR EACH EU COUNTRY FOR 2008 and 2009 • WORK INVOLVED COLLATING ALL HYDROCARBON AND OXYGENATED SALES FROM EU SOLVENT SUPPLIERS • TOTAL CHLORINATED SOLVENTS WERE INCLUDED • DATA WAS REPORTED IN 18 SEPARATE END-USE SECTORS • EXAMPLES include INDUSTRIAL CLEANING and PROFESSIONAL COATINGS
2008 HC SOLVENTS DATA • TOTAL 2.3Million tonnes for EU27 • OTHER category 1.7% • Industrial Coatings 13.8% • Use as Fuel/Combustion 11% • De-Icing 0.4%
2008 OXY SOLVENTS DATA • TOTAL 1.6Million Tonnes for EU27 • OTHER category 3.8% • Industrial Coatings 25% • 2008 CHLORINATED SOLVENTS • Total 154000tonnes
Converting Solvent Data to VOC Emissions Expert Judgement & ESIG SPERC Agrochemical uses 100% released Use as Fuel/Combustion 0.25% released De-Icing 100% released Industrial Cleaning 70% released Professional Cleaning 50% released Pharmaceuticals 30% released
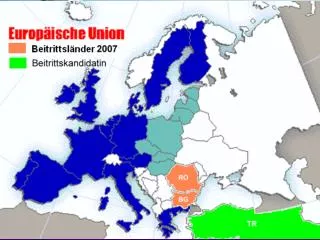
IMPORT/EXPORT within EU27 • Official CEFIC chemical sales show: • Holland, Belgium and Germany export • Some 20 countries including Austria, Poland and CZ Republic are net Importers • UK, France and Ireland are self contained • EU27 is assumed to consume all solvents i.e. no net export out of EU27
EU27 VOC SOLVENT EMISSIONS • UNITS IN KILOTONNES • ESIG EEA • 2008 2159 3335 • 2009 1917 3050 • ESIG SOLVENT VOC EMISSIONS are 63-65% of those of the official EEA Inventories
EU27 Solvent Emissions 2008 Country EEA Emissions (after export) 154 ( 76) 685 (279) 140 (57) 224 224 19 19 268 268 • Belgium + Lux 61 • Germany 669 • Netherlands 57 • United Kingdom 379 • Ireland 24 • France 386
EU27 Solvent Emissions 2008 Country EEA Emissions (after Import) 5 (33) 25 (51) 40 (86) 42 (110) 7 (24) 222 (328) 45 (86) 208 (355) Bulgaria+Romania 80 Baltic States +Finland 68 Austria+Slovenia 101 Poland 198 Hungary 23 Portugal+Spain 531 Cyprus+Greece 59 Italy 466
SPREADING THE MESSAGE Comments Accepted Accepted Accepted Accepted • German UBA 11/12 • UK Government 1/13 • French Authorities 2/13 • Irish Government 2/13 • IIASA-GAINS April 2013 • EMEP April 2013 • EEA-TNO April 2013 • TFEIM- May 2013
CONCLUSIONS Solvent VOC Emissions have been assessed for each EU27 country Total Solvent Emissions are between 63 and 65 % of the official EEA data Full details available for each EU country of HC &Oxygenated Solvents ESIG will consider providing regular updates for future years Continue to communicate • The data have been broken down into 18 separate end-use sectors • The exercise has been carried out for the years 2008 and 2009 • Good endorsement from influential contacts