Download
1 / 1
10 likes | 24 Vues
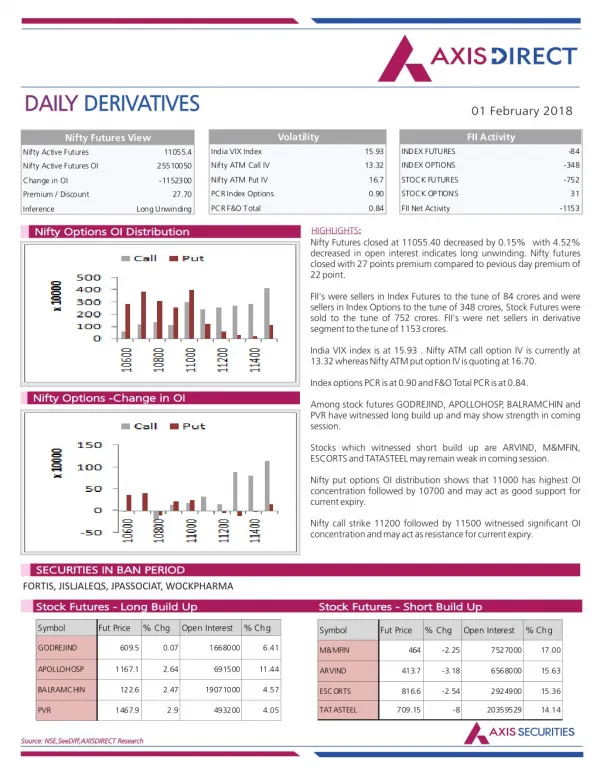
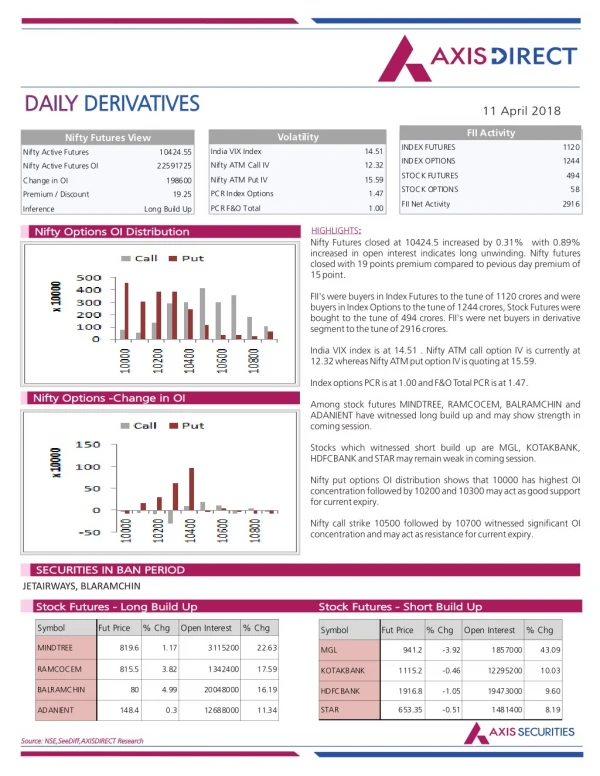
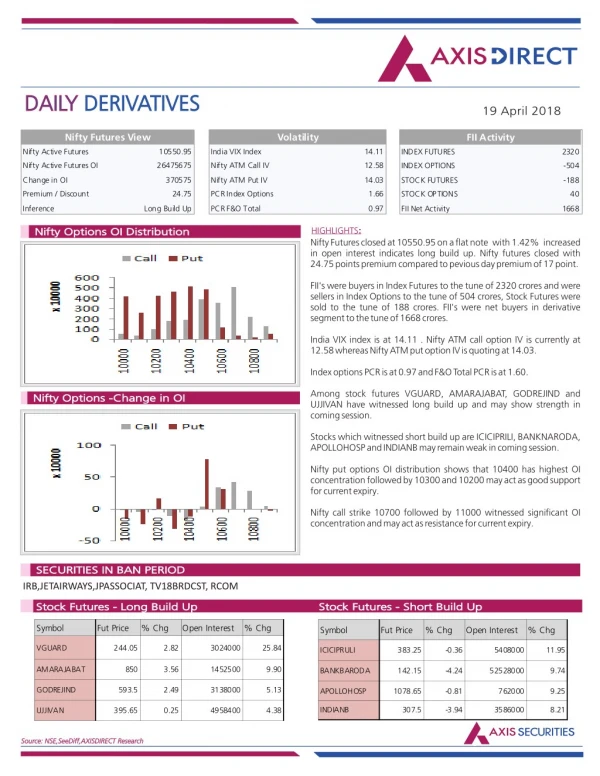
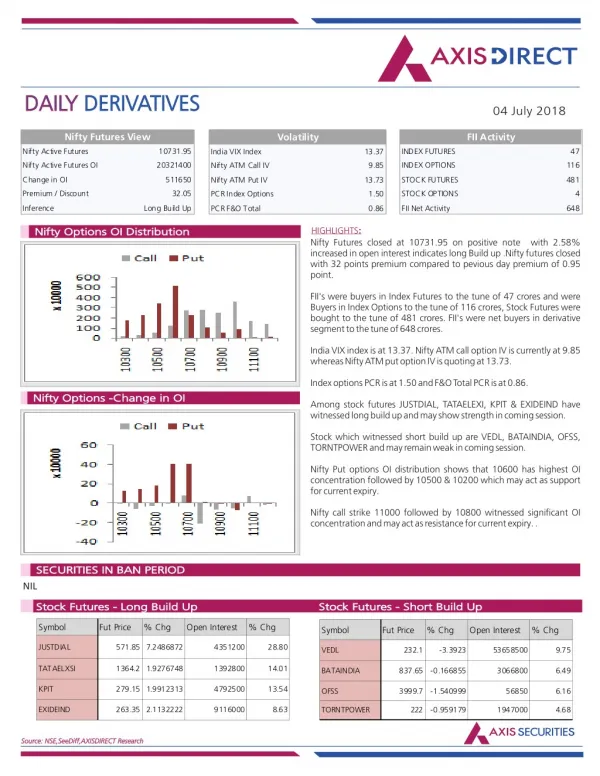
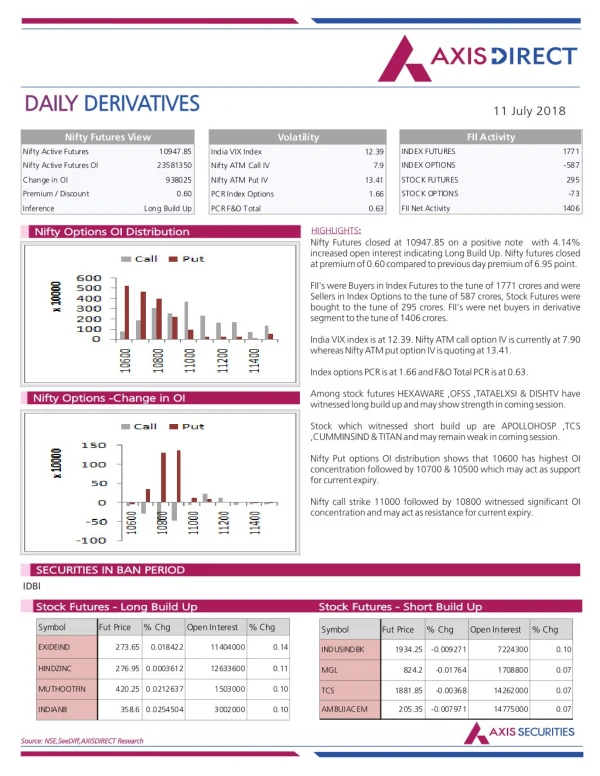
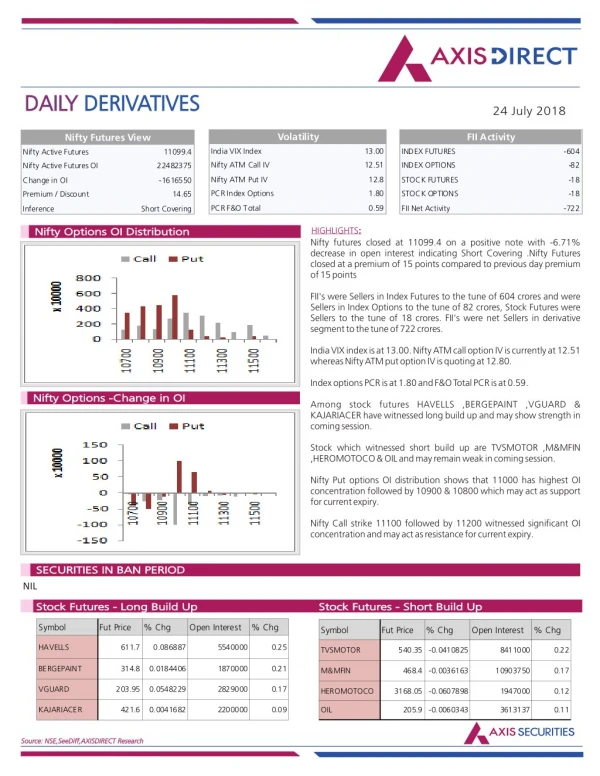
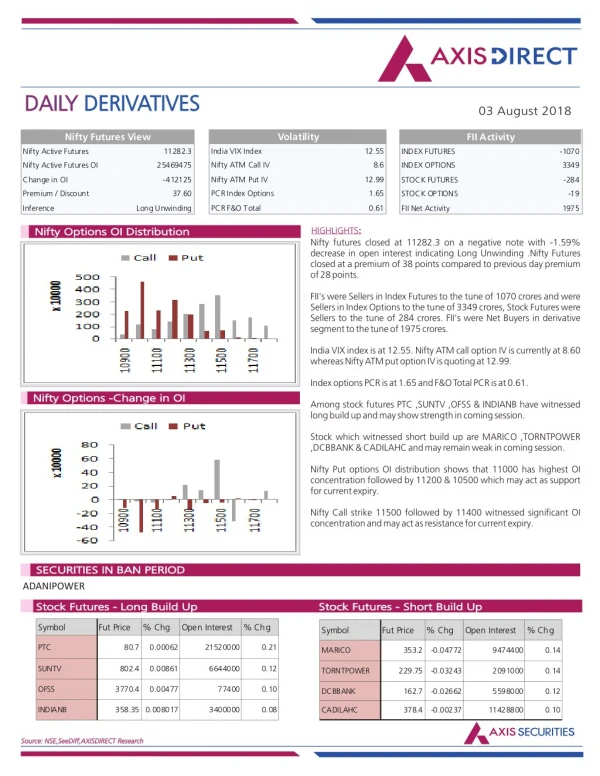
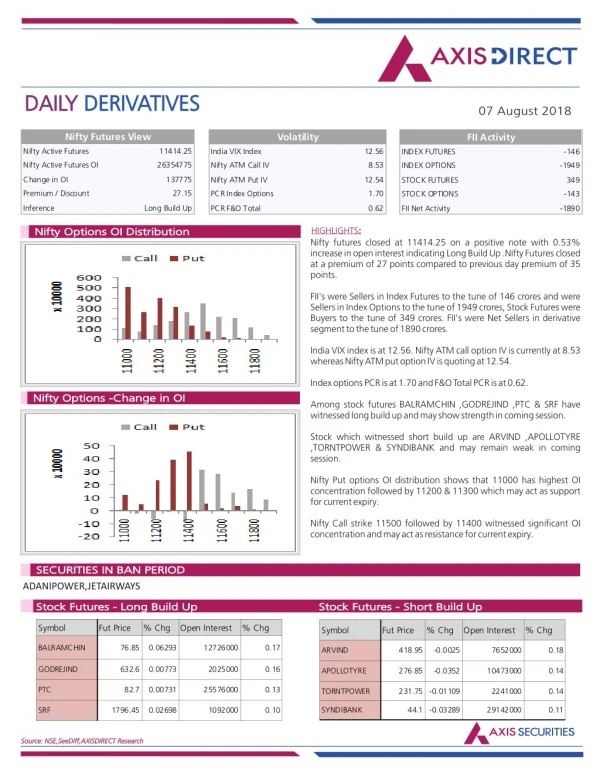
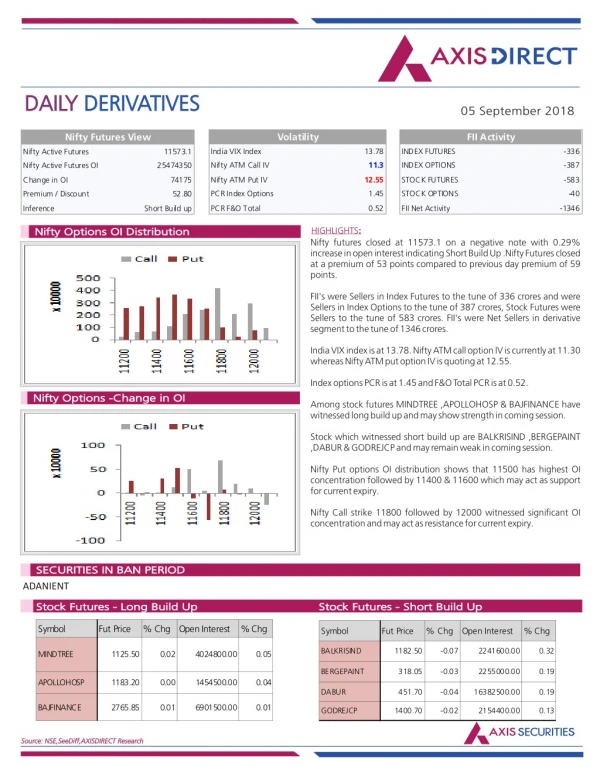
Axis Direct presents daily derivatives report presenting recommendations based on technical analysis. For trading in derivatives visit https://simplehai.axisdirect.in/offerings/products/derivatives<br>https://simplehai.axisdirect.in/share-stock-prices/nse/Bharat-Petroleum-Corporation-Ltd-2290<br>https://simplehai.axisdirect.in/share-stock-prices/nse/ITC-Ltd-301<br>

E N D
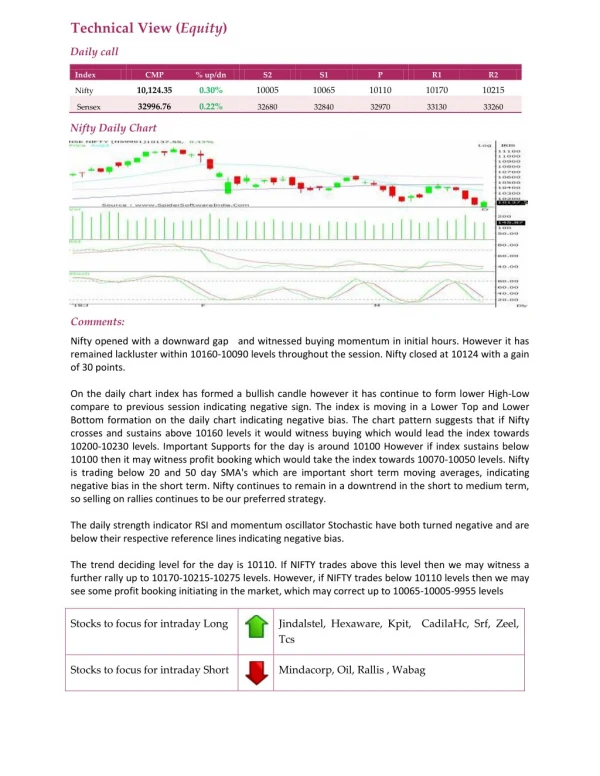
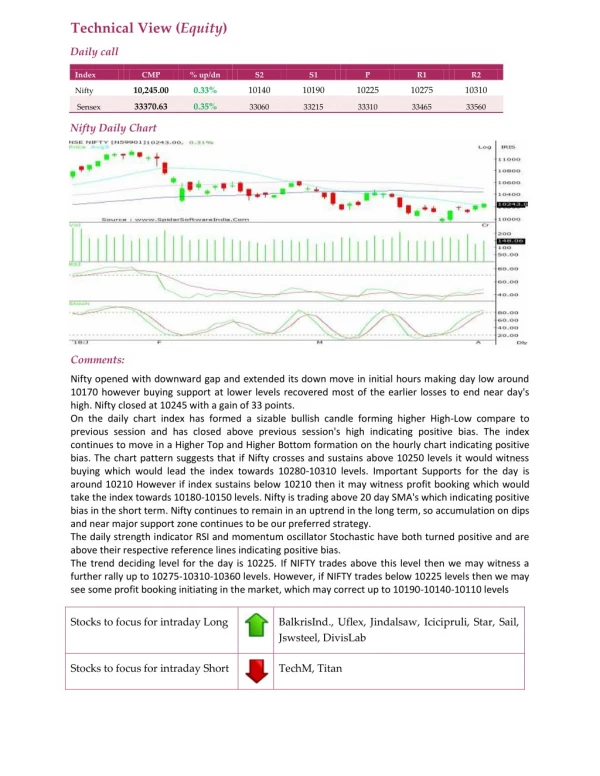
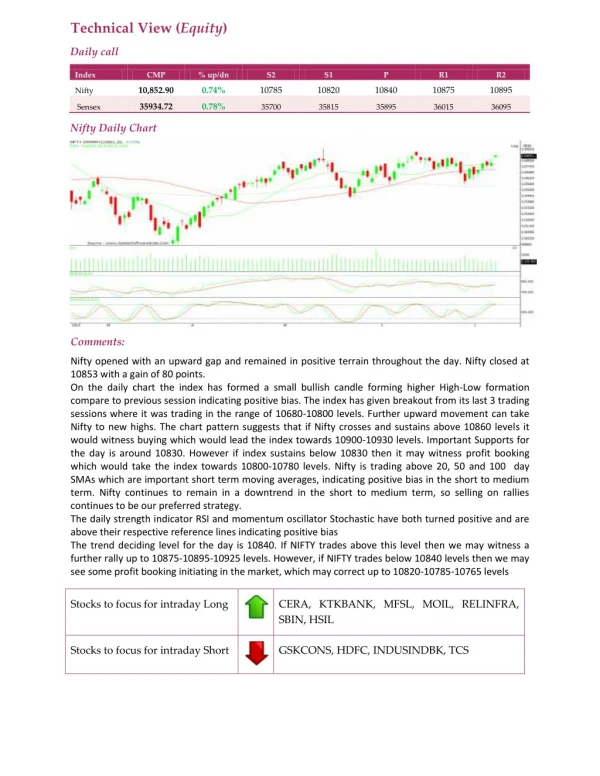
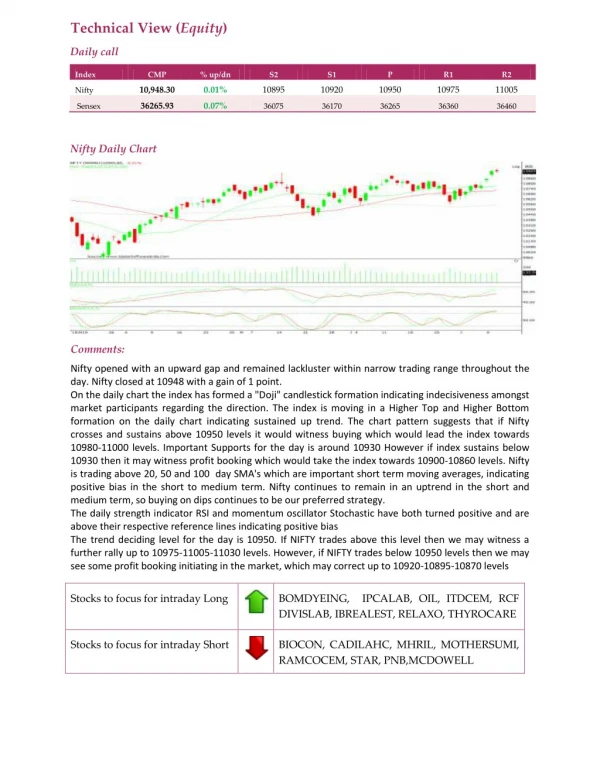
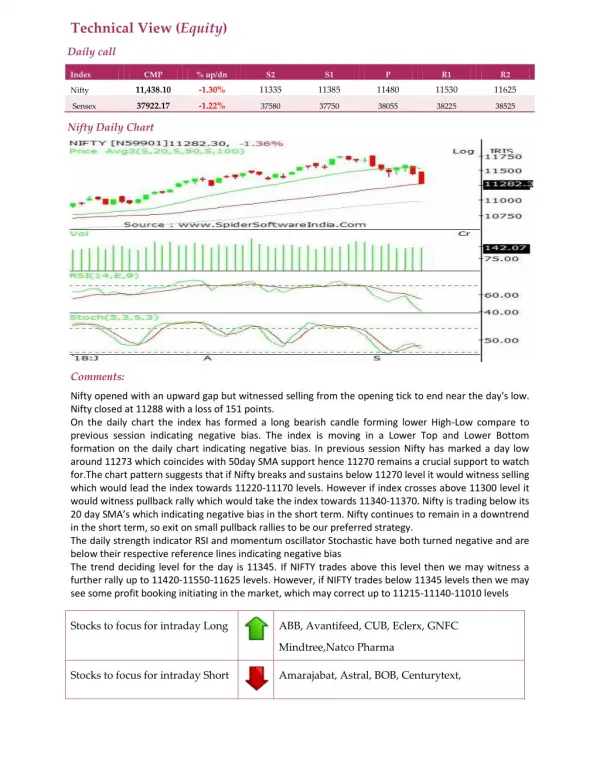
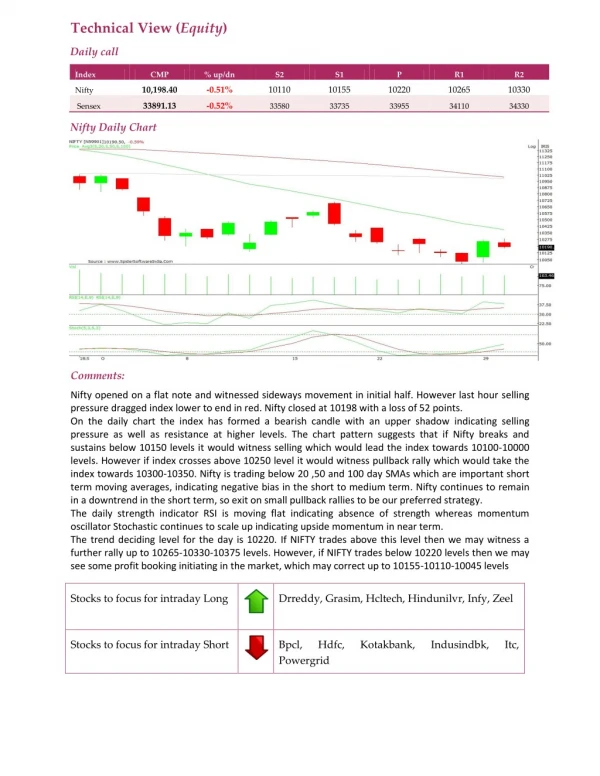
Technical View (Equity) Daily call Index CMP % up/dn S2 S1 P R1 R2 10,198.40 -0.51% 10110 10155 10220 10265 10330 Nifty 33891.13 -0.52% Sensex 33580 33735 33955 34110 34330 Nifty Daily Chart Comments: Nifty opened on a flat note and witnessed sideways movement in initial half. However last hour selling pressure dragged index lower to end in red. Nifty closed at 10198 with a loss of 52 points. On the daily chart the index has formed a bearish candle with an upper shadow indicating selling pressure as well as resistance at higher levels. The chart pattern suggests that if Nifty breaks and sustains below 10150 levels it would witness selling which would lead the index towards 10100-10000 levels. However if index crosses above 10250 level it would witness pullback rally which would take the index towards 10300-10350. Nifty is trading below 20 ,50 and 100 day SMAs which are important short term moving averages, indicating negative bias in the short to medium term. Nifty continues to remain in a downtrend in the short term, so exit on small pullback rallies to be our preferred strategy. The daily strength indicator RSI is moving flat indicating absence of strength whereas momentum oscillator Stochastic continues to scale up indicating upside momentum in near term. The trend deciding level for the day is 10220. If NIFTY trades above this level then we may witness a further rally up to 10265-10330-10375 levels. However, if NIFTY trades below 10220 levels then we may see some profit booking initiating in the market, which may correct up to 10155-10110-10045 levels Stocks to focus for intraday Long Drreddy, Grasim, Hcltech, Hindunilvr, Infy, Zeel Stocks to focus for intraday Short Bpcl, Powergrid Hdfc, Kotakbank, Indusindbk, Itc,