Inferencing Ethnicity from Mitochondrial DNA Sequences in Forensic Investigations
260 likes | 416 Vues
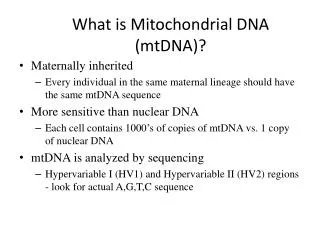
This study investigates the use of mitochondrial DNA (mtDNA) to infer ethnicity for forensic applications. Mitochondrial DNA, characterized by its circular structure and maternal inheritance, provides an advantageous source of genetic information, especially from degraded samples. Our research assesses the efficacy of four classification algorithms—Support Vector Machines (SVM), Linear Discriminant Analysis (LDA), Quadratic Discriminant Analysis (QDA), and 1-Nearest Neighbors (1NN)—to predict ethnicities based on hypervariable region (HVR) sequences. Results demonstrate the potential for enhanced accuracy in ethnic inference, assisting forensic investigators significantly.

Inferencing Ethnicity from Mitochondrial DNA Sequences in Forensic Investigations
E N D
Presentation Transcript
Inferring Ethnicity from Mitochondrial DNA Sequence Chih Lee1, Ion Mandoiu1 and Craig E. Nelson2 chih.lee@uconn.edu ion@engr.uconn.edu craig.nelson@uconn.edu 1Department of Computer Science and Engineering 2Department of Molecular and Cell Biology University of Connecticut
Outline • Introduction • Methods • Results and Discussions • Conclusions
Outline • Introduction • Methods • Results and Discussions • Conclusions
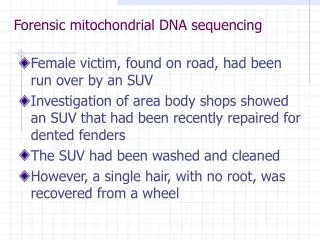
Ethnicity in Forensics • Ethnicity information assists forensic investigators. • Investigator-assigned ethnicity: based on genetic and non-genetic markers. • Genetic information enhances inference accuracy when accessto most informative markers (e.g. skin/hair) is limited. • Autosomal markers: • Excellent accuracy assigning samples to clades [Phi07, Shr97] • May not survivedegradation
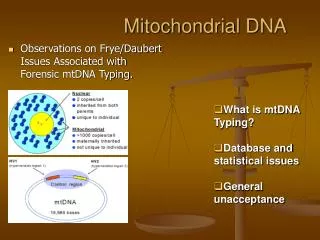
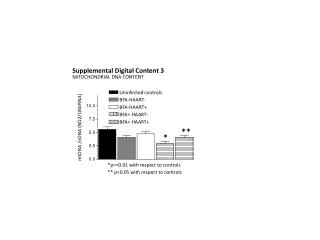
Mitochondrial DNA • Circular • 16,569 bps • Maternally inherited • High copy number Recoverable from degraded samples • Coding region • SNPs define haplogroups [Beh07] • Hypervariable Region
Hypervariable Region • High mutation rate compared to the coding region • Haplogroup inference [Beh07] • 23 groups • 96.7% accuracy rate with 1NN • Geographic origin inference [Ege04] • SE Africa, Germany and Icelandic • 66.8% accuracy rate with PCA-QDA
Ethnicity Inference from HVR • The problem: • Given a set of HVR sequences tagged with ethnicities • Predict the ethnicities of new HVR sequences • A classification problem • Our contribution: • Assess the performance of 4 classification algorithms: SVM, LDA, QDA and 1NN.
Outline • Introduction • Methods • Results and Discussions • Conclusions
Encoding HVR • Align to rCRS (revised Cambridge reference sequence) SNP profile • a SNP a binary variable • Missing data (not typed regions) • Assume rCRS • Use mutation probability • Common region
Support Vector Machines • Binary classification algorithm • Map instances to high-D space (the feature space) • Optimal separating hyperplane with max margins • Kernel function k(x1,x2): similarity x1 and x2 between in the feature space • Radial basis kernel: exp(-γ||x1-x2||2) • Software: LIBSVM [Cha01]
Linear/Quadratic Discriminant Analysis • Find argmaxg P(G=g|X=x) • Assumptions: • X|G=g ~Np(μg, Σg) • P(G=g)’s are equal for all g • P(G=g|X=x) prop. to P(X=x|G=g) • μg and Σg are estimated by the training data • LDA: common dispersion matrix Σg = Σ for all g
1-Nearest Neighbor • Assign a new sample to the dominating ethnicity among the nearest samples in the training data • Distance measure: the Hamming distance • Used by Behar et al. (2007) for haplogroup assignment
Principal Component Analysis • A dimension reduction technique • Used in conjunction with SVM, LDA and QDA • Denoted as: PCA-SVM, PCA-LDA and PCA-QDA
Outline • Introduction • Methods • Results and Discussions • Conclusions
The FBI mtDNA Population Database • Two tables: • forensic: typed by FBI • published: collected from literature • Retain only Caucasian, African, Asian and Hispanic samples
Data Coverage and Subsets • Variable sequence lengths • trimmed forensic dataset (4,426) • 16024-16365 • trimmed published dataset (1,904) • 16024-16365 • full-length forensic dataset (2,540) • 16024-16569, 1-576 forensic published
5-fold Cross-Validation (trimmed forensic) • Macro-Accuracy: Average of ethnicity-wise accuracy rates • Micro-Accuracy: Weighted by # Samples • More accurate than Egeland et al. (2004) • Matches human experts depending on skull and large bones [Dib83, isc83]
Seq. Region Effect on Accuracy 100% 90% 80% full-length forensic dataset • Different primers result in different coverage. • PCA-LDA outperforms 1NN on long sequences. • PCA-SVM is consistently the best.
Seq. Region Effect on Accuracy 80% 100% 90% full-length forensic dataset • HVR 2 contains less information. • PCA-SVM is consistently the best.
Twenty 10% Windows 10% 10% 10% • Accuracy varies with region. • PCA-SVM remains the best. • 1NN is as good as PCA-SVM for short regions.
Independent Validation (1/2) • Training data: trimmed forensic dataset • Test data: trimmed published dataset • PCA-SVM • No Hispanic samples in the test data but samples can be mis-classified as Hispanic • Asian: ~17% lower than CV
Independent Validation (2/2) • Composition of the Asian samples in the training data: • China (356 profiles), Japan (163), Korea (182), Pakistan (8), and Thailand (52) • Strong bias towards East Asia • 145 Mis-classified Asian samples in the test data: • 10 samples of unknown country of origin • 90 samples from Kazakhstan and Kyrgyzstan • Both countries have significant Russian population. • Evidence of admixture with Caucasians.
Handling Missing Data • Mimic real-world scenario • Training: forensic dataset • Test: published dataset • rCRS and Probability are biased toward Caucasian. • Common Region is the best overall.
Posterior Probability Calibration • PCA-SVM on published dataset with “Common Region” • Accuracy rates are slightly higher than the estimated posterior probabilities.
Conclusions • SVM is the most accurate algorithm among those investigated, outperforming • Discriminant analysis employed by Egeland et al. (2004) • 1NN similar to that used by Behar et al. (2007) • Overall accuracy of 80%-90% in CV and independent testing • Matches the accuracy of human experts depending on measurements of skull and large bones [Dib83,isc83] • Approaches the accuracy by using ~60 autosomal loci [Bam04]
Questions? • Thank you for your attention.