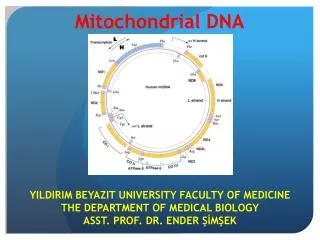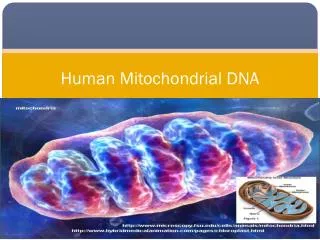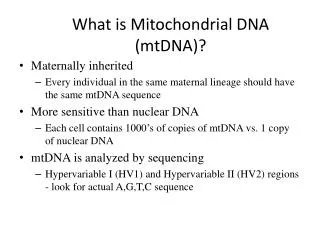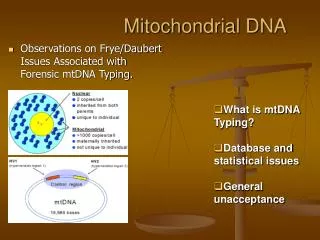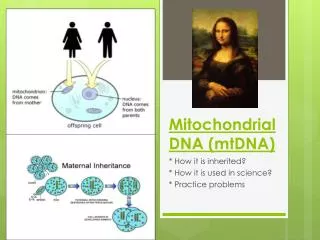
Mitochondrial DNA
Mitochondrial DNA. Movement of mitochondrial genes out of Africa. Y chromosome movement out of Africa. Population Genetics. Beginnings of Population Genetics.
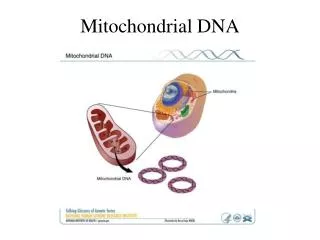

Mitochondrial DNA
E N D
Presentation Transcript
Beginnings of Population Genetics • From the beginning of Darwin’s formulation of evolution by natural selection, Darwin was very clear that small heritable changes provided the continuous variation on which natural selection acted –many biologists shared his views and were called selectionists • However, other biologists thought that continuous variation could not lead to new species or major evolutionary changes but felt instead that discontinuous variation (the origin of “sports” or large mutations) would be necessary to create evolutionary change • Nilsson-Ehle (1909) and East (1916) showed that many evolutionary traits function as quantitative characters (or continuous traits) where many gene pairs (multiple factors) interact and affect a single quantitative trait (such as body size or coat color) and that these traits have many different possible genotypes each with a different phenotype
Neo-Darwinian Synthesis • Population genetics and the emphasis of viewing evolution as changes in gene frequencies within populations resulted in the so-called Modern or Neo-Darwinian Synthesis from which almost all modern evolutionary thought still comes • Much of population genetics has been developed by referring to fairly simple mathematical models which give much insight into how simplified populations operate and evolve over time
Architects of the Neo-Darwinian Synthesis Theodosius Dobzhansky Ernst Mayr J.B.S. “Jack” Haldane George Gaylord Simpson Sir Ronald Fisher
Architects of the Neo-Darwinian Synthesis Galesburg’s Own – Sewall Wright
What is a population? • a population is a group of sexually interbreeding or potentially interbreeding individuals • because Mendelian laws apply to the transmission of genes among these individuals, Wright called these groups Mendelian populations • the population is usually considered to be a geographically defined group
MAP AREA CANADA ALASKA Beaufort Sea NORTHWEST TERRITORIES Porcupine herd range Porcupine herd Fortymile herd range ALASKA YUKON Fortymile herd
Population Genetic Models Populations must have two important traits for these models: 1. Gene frequency – proportion of different alleles of a gene in a population (should really be called allele frequency but often is just called gene frequency) 2. Gene Pool – sum total of all the genes in all the members of a population – often considered to be the genes in all the gametes of a population
Hardy-Weinberg Equilibrium Hardy-Weinberg Equilibrium is based on: 1. A very large population where all genotypes are equally viable 2. Random mating (panmixia) 3. No mutations 4. No gene flow (dispersal of individuals and their genes) 5. No natural selection
CRCR CWCW CRCW
Alleles in the population Gametes produced Frequencies of alleles p = frequency of Each egg: Each sperm: CR allele = 0.8 q = frequency of 20% chance 20% chance 80% chance 80% chance CW allele = 0.2
80% CR (p = 0.8) 20% CW (q = 0.2) Sperm CW CR (20%) (80%) CR (80%) 64% (p2) CRCR 16% (pq) CRCW Eggs CW 16% (qp) CRCW 4% (q2) CWCW (20%) 64% CRCR, 32% CRCW, and 4% CWCW Gametes of this generation: 64% CR (from CRCR plants) 16% CR (from CRCW plants) + 80% CR = 0.8 = p = 4% CW (from CWCW plants) 16% CW (from CRCW plants) + 20% CW = 0.2 = q = Genotypes in the next generation: 64% CRCR, 32% CRCW, and 4% CWCW plants
80% CR (p = 0.8) 20% CW (q = 0.2) Sperm CW CR (20%) (80%) CR (80%) 64% (p2) CRCR 16% (pq) CRCW Eggs CW 4% (q2) CWCW 16% (qp) CRCW (20%)
Sperm CR (20%) (80%) CW CR (80%) 16% (pq) CRCW 64% (p2) CRCR Eggs CW 16% (qp) CRCW 4% (q2) CWCW (20%) 64% CRCR, 32% CRCW, and 4% CWCW Gametes of this generation: 64% CR (from CRCR plants) 16% CR (from CRCW plants) + = 80% CR = 0.8 = p 4% CW (from CWCW plants) 16% CW (from CRCW plants) + 20% CW = 0.2 = q = Genotypes in the next generation: 64% CRCR, 32% CRCW, and 4% CWCW plants
A human example Matsunaga and Itoh collected the MN blood types from 741 couples (or 1,482 individuals) in a small Japanese town – this town had genotypic proportions of: .274 MM; .502 MN; and .224 NN – remember MN is an example of codominance so it is easy to score people for exact genotype
An albino family tree – A not albino allele; a albino allele
Hardy-Weinberg and albinism • In a typical human population, albino’s are present at about 1 in 20,000 • Or q2 = 1/20,000 = 0.00005 • What proportion of the population carry the albino allele?