Download

1 / 12
120 likes | 219 Vues
This comprehensive study by Global Concepts Inc. analyzes the service parts distribution network to enhance supply chain efficiency. Key accomplishments include assessing existing parts flow, defining scenarios for network expansion, and analyzing market coverage based on warehouse configurations and service levels. The study outlines four new scenarios alongside a baseline model, evaluating total costs related to transportation, warehousing, and inventory investments. The results present pros and cons for each scenario, highlighting potential multimillion-dollar savings and viable outsourcing options for implementation.

E N D
STRATEGIC MODELING ANDANALYSISOFSERVICE PARTS DISTRIBUTION Global Concepts Inc. Don Stuart, Frank Forbes University of Oklahoma Tom Landers, Simin Pulat, Jerry Dechert Shein-Loong Yap, Santosh Parameshwaran, Yvonne Splinter
Accomplishments • Location and cost study of the parts flow over the existing supply chain network • Definition of scenarios for changes/expansion of the current practice • Market coverage analysis as a function of number of warehouses and service level requirements • Comparison of total costs (transportation, warehouse, and inventory investment) • Recommendations
Scenario Definitions and Evaluations • Baseline scenario and 4 new scenarios defined by the steering committee • Optimal location of each warehouse determined while considering the entire supply chain • Baseline model validated and compared to the 4 new scenarios in terms of total cost • Transportation Cost • Warehousing Cost • Inventory Investment Cost
Scenario 2 Results – One National and 7 Regionals Regionals: NYC, Tallahassee, Akron, SF, Chicago, Dallas, Greensboro
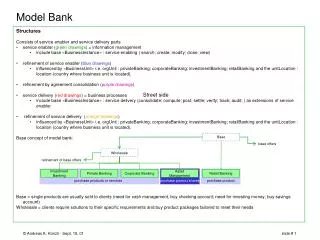
Inventory Simulation • Randomly generate customer demand at Part Centers. • Track inventory and order weekly. • RDCs/NDC order weekly from suppliers. • Collect statistics on in-stock rate, fill rate, and average inventory at PCs and RDCs/NDC.
Market Coverage Analysis : 2-day coverage : 1-day coverage
Market Coverage with One National and 5 Regionals • Red: Covered by 1-day UPS ground • White : Not covered by 1-day UPS Ground • Blue: Regional RDCs
SCENARIO 2 ADVANTAGES: 1. Parts directly shipped from suppliers to regionals (stock replenishment) 2. Local stores close to regionals (min. transit time) DISADVANTAGES: 1. Result is high in-bound freight costs for regionals. 2. Two freight bills will be generated as part of the order will ship from the regional and part of the order from where the slow moving is held. 3. It is necessary to duplicate the process to package and label parts (WIP at all regional locations.
Impact • Market Coverage and Location Study Results • Pros and Cons of Each Scenario • Multimillion Dollar Savings • Outsourcing options – pros and cons • Implementation Phase