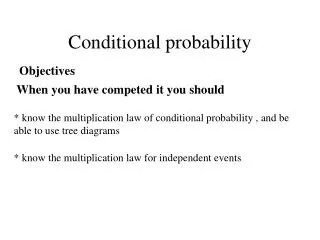
Conditional Probability
Explore the relative frequency and conditional probability of different categories of workers based on years of service. The table provided lists the distribution of work experience among 789 employees, and you can calculate the relative frequencies and conditional probabilities for various scenarios, such as gender and years of service ranges. Enhance your understanding of probability in the context of workforce demographics.


Conditional Probability
E N D
Presentation Transcript
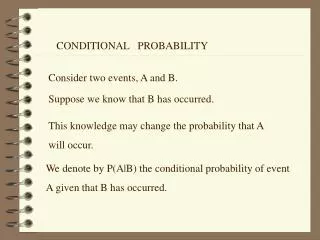
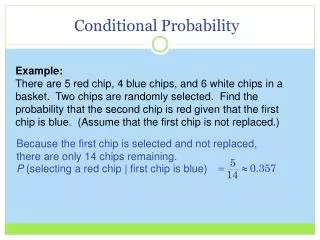
Conditional Probability Given that…
Relative Frequency The following table gives the years of service of the 789 workers at High Tech Manufacturing. Complete the table to display the total number of workers in each Category.
Relative Frequency • Each of the numbers in that table can be considered a frequency for that category. • If you consider this frequency a fractional part of the whole workforce, it becomes the Relative Frequency. • For example the relative frequency of male workers with less than one year experience is .
Relative Frequency • Calculate the relative frequency, expressed as a decimal, for each category.
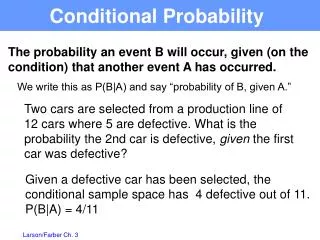
Conditional Probability • Suppose the conditions become more specific. • For example, what is the probability that someone has less than one years experience given that they were a male? • This eliminates all the females from the bottom denominator and makes the probability… • .
Conditional Probability • Find p(female|between 1and 10 years)
Conditional Probability Review Complete the table. What is the probability that the student is a boy given that they are Over 16? 2. What is the probability that the student is a girl who is also at least 16 years old? What is the probability some is under 16 given that they are also a boy?