Download
1 / 33
330 likes | 415 Vues
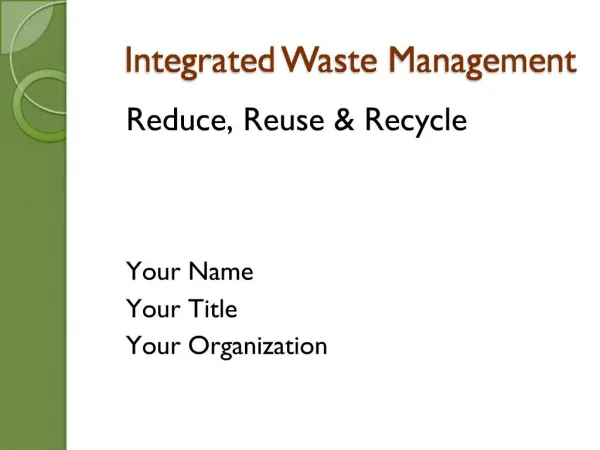
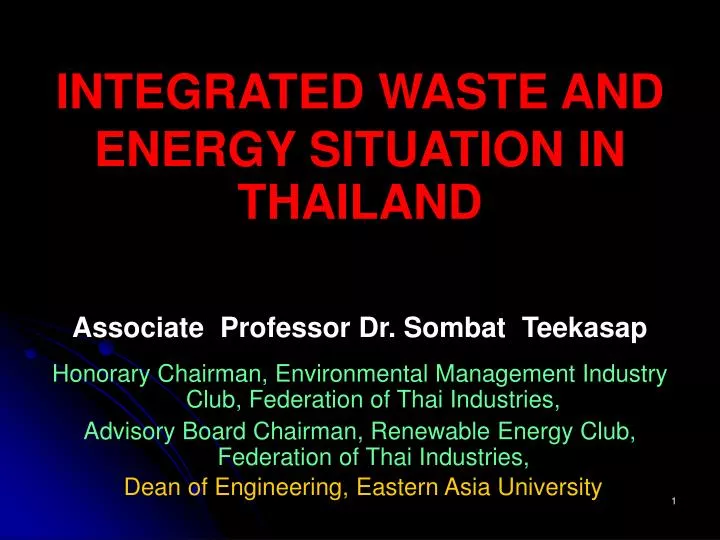
INTEGRATED WASTE AND ENERGY SITUATION IN THAILAND. Associate Professor Dr. Sombat Teekasap Honorary Chairman, Environmental Management Industry Club, Federation of Thai Industries, Advisory Board Chairman, Renewable Energy Club, Federation of Thai Industries,

E N D
INTEGRATED WASTE AND ENERGY SITUATION IN THAILAND Associate Professor Dr. Sombat Teekasap Honorary Chairman, Environmental Management Industry Club, Federation of Thai Industries, Advisory Board Chairman, Renewable Energy Club, Federation of Thai Industries, Dean of Engineering, Eastern Asia University
COMMUNITY SOLID WASTE VOLUME ACCORDING TO AREAS 14.63 million tons/year. (2006) Only 36% manage according to standard.
COLLECTION OF SOLID WASTE • City of Bangkok 100% • Municipalities (4780 ton/d) 37% • Others (1120 ton/d) 6%
COMPOSITION OF COMMUNITY SOLID WASTE • Biological materials (about 46%) • Recyclable materials (about 42%) • Hazardous materials (about 3%) • Others (about 9%)
WASTE MANAGEMENT • Secure landfill 90 • Combined management 3 • Incineration 3
UTILISATION OF WASTE • Community solid waste 3.19 Mton (22 %) – 0.20 Mton as compost and liquid fertilizer, 2.99 Mton as recycle materials. • Agriculture solid waste 18.6 Mton (22.6%) – 15.7 Mton as fuel, 2.6 Mton as animal feed, 0.3 as compost. (Estimated)
UTILISATION OF WASTE • Municipal Solid waste 2.99 Mton – Paper 0.9269 Mton (38%). – Glass 0.7475 Mton (64%). – Plastic 0.3588 Mton (25%). – Iron 0.8671 Mton (90%). – Aluminum 0.0897 Mton (54%).
INDUSTRIAL SOLID WASTE VOLUME12.66 million tons/year. (2006) UTILISATION OF WASTE • Industrial Solid waste 8.24 Mton (65%) – Paper 1.575 Mton (51%). – Glass 1.200 Mton (68%). – Plastic 0.457 Mton (22%). – Iron 4.478 Mton (94%). – Aluminum 0.425 Mton (71%). – Rubber 0.102 Mton (26%).
10 Municipalities 30 Municipalities 150 Municipalities Municipal waste more than 200 tons/day Municipal waste more than 100 tons/day Municipal waste more than 50 tons/day
PRESENT STRUCTURE • Only few proper sorting plants are running. Some are stop operation or not running as original design. • Few solid community waste incinerators are still running. (Around 3 sites) • Most of solid waste sent to landfill site. Some of landfill sites are still under standard. (Around 90 sites are acceptable) • Only two anaerobic digestion from waste plants are running but at not designed capacity.
PRACTICAL ALTERNATIVES • Develop laws and regulation to promote a total good practice in waste management. • Support private sectors to run waste management projects. • Do intensive public relation for wide spread acceptance of publics in supporting good waste management practice.
PRACTICAL ALTERNATIVES • Set a new target - Reduction waste rate at not more than 1 kg/d/p. - Set up centers for complete solid waste management. • Support full eco-town program.
FUTURE DEVELOPMENT • Sorting plants. • Upgrading recyclable material plant. • Electronic waste recycling plant. • Hazardous waste recycle plant. • Waste exchange program. • Waste to energy –Highly interested by researchers and investors (both local and foreigner) in producing electricity and fuel oil.
FUTURE DEVELOPMENT • Composting plant • Bio-liquid and compost earth wormiest system • Individual house composting • New recycle technique • Bio-gas fermentation plant • Other Waste to Energy System (Gasification, Direct Burning, and etc.)
INVESTMENT OPPORTUNITIES (INDUSTRIAL WASTE) • Report on volume of hazardous and non hazardous waste required by Ministry of Industry will increase the opportunity for new business investment. • There still lack of proper industrial waste management in some product, such as electronic batteries. • New strictly law enforcement can stop illegal business. • Wide spread public concern.
Situation • E-wastes have continued to increase rapidly. ~12% per annum Source: PCD, 2004
Situation • E-wastes have high potential to be recycled. Source: PCD, 2004
Situation • Illegal traffic of sub-standard EEE or E-wastes
Situation • Poor domestic facilities
Concept of E-waste Strategic Plan • Polluter Pays Principle • Co-Responsibilities among Producer, Importer and Consumer • Specific Fund • New Law • Public Education, PR, R&D (Eco-product development), etc.
INVESTMENT OPPORTUNITIES (ELETRONIC WASTE) High margin Strength First invest – first success High investment for efficiency plant Collection logistic and Volume E-Waste Weakness Complicated / Unmatched regulations Complicated import – export process
Energy Situation 2006 miniing 0.2 % agricultural 5.3% Industry 37.8% transport 36.0% business 6.2% residential 14.3% construction 0.2 % Energy Consumption in Industry and Business27,768 ktoe (15,100mill USD) Source: Energy Report DEDE 2006
3.Comparison of Energy Intensity per GDP by Country Note: Primary energy consumption (tons in oil equivalent)/GDP (thousand US$) indicated in the ratio when the Japanese figure is set at 1. Source: IEA Energy Balance 2006
Thailand’s Energy Situations • In 2005, energy costs accounted to about 15% of GDP. • Oil imports accounted to 12% of total import values. • 60% of commercial energy was imported or about 700 billion baht. • Still rooms for energy efficiency improvement. Agriculture 6% Resident & Commercial 21% Industry 36% Transport 37%
Energy Elasticity1998 - 2005 AVG Energy Elasticity 1.05:1
Energy Intensity1998 - 2005 Toe/Million baht , (ktoe), Billion Baht 30,000 16 15 . 69 15 . 40 15 . 09 15 . 16 15 . 23 14 . 99 14 14 . 89 14 . 79 25,000 22,643 21,961 12 19,988 20,000 18,679 10 16,922 16,208 15,488 15,000 8 13,754 6 10,000 4 5,000 2 1,500.10 1,426.09 1,318.28 1,190.81 1,096.17 1,111.46 1,033.43 923.60 0 0 2541 2542 2543 2544 2545 2546 2547 2548 Energy Consumption (ktoe) GDP (billion baht) EI (toe/million baht)
Industrial Energy Demand Unit: ktoe Summary of findings of EU Soltherm project Source: Thailand Energy Situation 2005, DEDE
ELECTRIC POWER FROM RENEWABLE ENERGY BUYING RATE FEE ADDER • Conditions : Supporting period 7 years, < 10 MWto grid according toVSPP policy, and New plant.
THANK YOU VERY MUCH