Exploring Rare t → 3μ Decay in Supersymmetric Models: Experimental Insights and Future Directions
This analysis investigates the rare decay channel t → 3μ, which is suppressed in the Standard Model but predicted by beyond-the-Standard-Model scenarios, such as the Supersymmetric see-saw model. We detail experimental results from the LHC, including selected backgrounds and efficiencies related to signal detection. The study utilizes ATLFAST for simulation, comparing the t → 3μ signal against major background sources like Ds → μν and f → μμ. Ongoing work aims to enhance analysis sensitivity while accounting for additional background contributions.

Exploring Rare t → 3μ Decay in Supersymmetric Models: Experimental Insights and Future Directions
E N D
Presentation Transcript
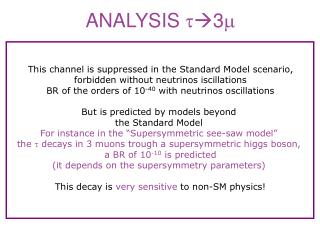
ANALYSIS t3m This channel is suppressed in the Standard Model scenario, forbidden without neutrinos iscillations BR of the orders of 10-40 with neutrinos oscillations But is predicted by models beyond the Standard Model For instance in the “Supersymmetric see-saw model” the t decays in 3 muons trough a supersymmetric higgs boson, a BR of 10-10 is predicted (it depends on the supersymmetry parameters) This decay isvery sensitiveto non-SM physics!
OTHER EXPERIMENT RESULTS Actual best limit with real data: BABAR BR< 1.9 x 10⁻⁷ 90% C.L. (published in 2005) CMS t3m10fb-1 |eta|<2.4 , tau dalla sorgente W SIGNAL + BACKGROUND after 1 year of LHC with the hypothesis of BR=1.9E-6 s =15MeV In caso di NON presenza di segnale: BR<8.4E-8 @ 90% C.L.
SIGNAL At LHC the t can be produced by different processes: tfrom D mesons s(ppDt X) = 144 mb tfrom B mesonss(ppBt X) = 24 mb t from W decays(W)*BR(Wtn) = 19 nb tfrom Z decays(Z)*BR(Ztt) = 3 nb For the moment we are studing the production of tau from W decays. Thet 3m decay has been inserted in PYTHIA forcing the two neutrinos of tm n n to be muons…no matrix element is inserted in PYTHIA! Assuming a BR (t 3m ) = 8 x 10⁻⁸ … we expect: N = s x L x BR = 15.2 events in 10 fb-1 45.6 events in 30 fb-1
SIGNAL:PRESELECTION AND TRIGGER EFFICIENCY Transverse momentum (MeV) distributions of the 3 muons after preselection: MeV Preselection cut: 3 muons with pt > 3 GeV and |η|<2.5 Preselection efficiency: 38% Trigger cut: 2 muons with pt > 6 GeV Trigger efficiency: 89% of the preselected events Preselection & Trigger = 36%
BACKGROUND: ccbar ALL 106 events was generated with a cut on pt(quark) > 6 GeV muons pt distribution quark pt distribution 6 GeV 6 GeV 765 out of 106 events have 3 muons in the final state. One muon is produced by a Ds,D0,D+ and a couple of muons is produced by a f,η,r that are not produced by the Ds,D0,D+. 3 GeV
BACKGROUND from single channels • Main background sources from Ds decays: • 1) Dsmnf (2%) con fmm (2.5x10⁻⁴) • Dsmnη (3%) con η mmg (3.1x10⁻⁴) • Plots showed in the next slides are obtained with the program of fast • simulation of the atlas detector: ATLFAST • Other channels give small contribute: • D+mnη (0.1%) con η mmg (3.1x10⁻⁴) • D+mnr (0.1%) con rmm (4.6x10⁻⁵) • D+mnη’ (0.1%) con η’ mmg (1.0x10⁻⁴)
Dsfmnfmm s(ccbar) = 8 mb if pt(quark)>10GeV s(ccbar) = 3.76 x 10⁻² mb N(ccbarDsDx)/N(ccbarALL) = 22% BR(Dsmnf) = 3% BR(fmm) = 2.5 x10⁻⁴ with these numbers we expect: 660000 events in 10 fb-1 1.98 x10⁶ events in 30 fb-1
Dsfmnfmm PRESELECTION AND TRIGGER Transverse momentum distributions of the 3 muons after preselection: MeV Preselection: 3 muons with pt > 3 GeV and |η|<2.5 Preselection efficiency: 1.7% Trigger cut: 2 muons with pt > 6 GeV Trigger efficiency: 13% of the preselected events Preselection & Trigger = 0.37%
t3mvs Dsfmnfmm COMPARISON Assuming BR(t3m) = 8 x 10⁻⁸ After trigger the signal to background ratio is : S/B = 0.0036
Missing Et cut MEt > 20 GeV BCKG SIGNAL
Spatial separation between the muons cut: DRij < 0.2 BCKG DR13 DR23 DR12 SIGNAL DR13 DR23 DR12
F-veto Invariant mass distribution of muon combination with invariant mass closest to the f mass. BCKG BCKG SIGNAL mij < (mf- 30MeV) mij > (mf+30MeV) Invariant mass distribution of random muon combination.
t3mvs Dsfmnfmm COMPARISON AFTER CUTS After the cuts the signal to background ratio is : S/B = 1.5
Signal: reconstructed M3m Only preselection Mean 1777 Sigma 16.36 After all cuts Mean 1777 Sigma 16.8
M3m : t3m& Dsfmnfmm comparison Preselection level After trigger After missing Et cut After DR and f-veto Events normalized to 10fb-1 integrated luminosity
Dsηmn ηmmg Preselection level After trigger After f-veto
CONCLUSIONS… An analysis using ATLFAST has been done comparing the signal with the main backgrounds Dsfmn fmm and Dsηmnηmmg After the analysis cuts no background events are found in the Mt window. Analysis with ATLFAST: Repeat with more statistic and add the cut on the muon isolation…(work in progress!) Repeat the analysis with tha Atlas FULL SIMULATION…(work in progress!) Study background from bbbar events Study the contribution to the background do to pp mu mu X where X is reconstructed as a muon (fake). Recover the events with one muons with pt < 3 GeV (no preselection) Include the matrix element of the t decay in 3 muons …TO DO…