Measures of Central Tendency & Spread
270 likes | 793 Vues
Measures of Central Tendency & Spread. CCGPS Coordinate Algebra Unit 4: Describing Data. Day 90. Learning Target: Students can interpret differences in shape, center, and spread in the context of the data sets, accounting for possible effects of extreme data points.

Measures of Central Tendency & Spread
E N D
Presentation Transcript
Measures of Central Tendency & Spread CCGPS Coordinate Algebra Unit 4: Describing Data
Day 90 Learning Target: Students can interpret differences in shape, center, and spread in the context of the data sets, accounting for possible effects of extreme data points.
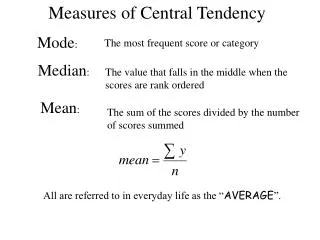
Definition of Measures of Central Tendency • A measure of central tendency is a measure that tells us where the middle of a bunch of data lies. • The three most common measures of central tendency are the mean, the median, and the mode. • Also referred to as “Center”
Mean The average value of a data set, found by summing all values and dividing by the number of data points
Median • Median is the number present in the middle when the numbers in a set of data are arranged in ascending or descending order. If the number of numbers in a data set is even, then the median is the mean of the two middle numbers.
Median The middle-most value of a data set; 50% of the data is less than this value, and 50% is greater than it Example:
Mode • Mode is the value that occurs most frequently in a set of data.
Measures of Spread • Measures of spread describe how similar or varied the set of observed values are for a particular variable (data item). Measures of spread include the range, quartiles and the interquartile range, variance and standard deviation. • It is usually used in conjunction with a measure of central tendency, such as the mean or median, to provide an overall description of a set of data.
Why is it important to measure the spread of data? There are many reasons why the measure of the spread of data values is important, but one of the main reasons regards its relationship with measures of central tendency. A measure of spread gives us an idea of how well the mean, for example, represents the data. If the spread of values in the data set is large, the mean is not as representative of the data as if the spread of data is small. This is because a large spread indicates that there are probably large differences between individual scores. Additionally, in research, it is often seen as positive if there is little variation in each data group as it indicates that the similar.
Range • The range is the difference between the highest and lowest scores in a data set and is the simplest measure of spread. So we calculate range as: Range = maximum value - minimum value
Quartiles • Quartiles tell us about the spread of a data set by breaking the data set into quarters, just like the median breaks it in half. • Quartiles are the values that divide a list of numbers into quarters.
To Create Quartiles… • First put the list of numbers in order • Then cut the list into four equal parts • The Quartiles are at the "cuts"
First Quartile The value that identifies the lower 25% of the data; it is the median of the lower half of the data set; written as Example:
Third Quartile Value that identifies the upper 25% of the data; it is the median of the upper half of the data set; 75% of all data is less than this value; written as Example:
Example: 5, 8, 4, 4, 6, 3, 8 1. Put them in order: 3, 4, 4, 5, 6, 8, 8 2. Cut the list into quarters:
And the result is: Quartile 1 (Q1) = 4 Quartile 2 (Q2), which is also the Median, = 5 Quartile 3 (Q3) = 8
Example: 1, 3, 3, 4, 5, 6, 6, 7, 8, 8 • The numbers are already in order • Cut the list into quarters: In this case Quartile 2 is half way between 5 and 6: Q2 = (5+6)/2 = 5.5
And the result is: Quartile 1 (Q1) = 3 Quartile 2 (Q2) = 5.5 Quartile 3 (Q3) = 7 A common way of expressing quartiles is as an interquartile range.
Interquartile Range • The interquartile range describes the difference between the third quartile (Q3) and the first quartile (Q1), telling us about the range of the middle half of the scores in the distribution. • The "Interquartile Range" is from Q1 to Q3
To calculate it just subtract Quartile 1 from Quartile 3. The Interquartile Range is: Q3 - Q1 = 8 - 4 = 4
Interquartile Range The numbers below represent the number of homeruns hit by players of the Wheelr baseball team. 2, 3, 5, 7, 8, 10, 14, 18, 19, 21, 25, 28 Q1 = 6 Q3 = 20 Interquartile Range: 20 – 6 = 14 Do the same for Harrison: 4, 5, 6, 8, 9, 11, 12, 15, 15, 16, 18, 19, 20
A data value that is much greater than or much less than the rest of the data in a data set; mathematically, any data less than or greater than is an outlier Example: Outlier
Box and Whisker Plot The numbers below represent the number of homeruns hit by players of the Wheeler baseball team. 2, 3, 5, 7, 8, 10, 14, 18, 19, 21, 25, 28 Q1 = 6 Q3 = 20 Interquartile Range: 20 – 6 = 14 6 12 20
4, 17, 7, 14, 18, 12, 3, 16, 10, 4, 4, 11 • Put the numbers in order: 3, 4, 4, 4, 7, 10, 11, 12, 14, 16, 17, 18 • Cut it into quarters: 3, 4, 4 | 4, 7, 10 | 11, 12, 14 | 16, 17, 18
3, 4, 4 | 4, 7, 10 | 11, 12, 14 | 16, 17, 18 In this case all the quartiles are between numbers: Quartile 1 (Q1) = (4+4)/2 = 4 Quartile 2 (Q2) = (10+11)/2 = 10.5 Quartile 3 (Q3) = (14+16)/2 = 15 Also: The Lowest Value is 3, The Highest Value is 18