Download
1 / 18
180 likes | 204 Vues
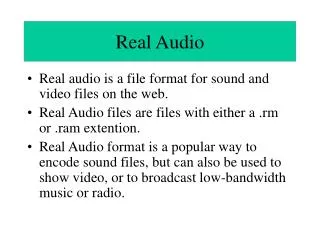
Explore frequency computations in sound files and learn about the frequency domain. This includes digitizing sound for graphics, equal-tempered tuning, adding sinusoids, and deciphering noisy signals.

E N D
25. Working with Sound Files Cont’d Frequency Computations Touchtone Phones
We looked at the time domain Sample number Time
What about the frequency domain? >> phone
A “pure-tone” sound is a sinusoidal function = the frequency Higher frequency means that y(t) changes more rapidly with time.
Digitize for Graphics Digitize for Sound % Sample “Rate” n = 200 % Sample times tFinal = 1; t = 0:(1/n):tFinal % Digitized Plot… omega = 8; y= sin(2*pi*omega*t) plot(t,y) % Sample Rate Fs = 32768 % Sample times tFinal = 1; t = 0:(1/Fs):tFinal % Digitized sound… omega = 800; y= sin(2*pi*omega*t); sound(y,Fs)
Equal-Tempered Tuning 0 A 55.00 110.00 220.00 440.00 880.00 1760.00 1 A# 58.27 116.54 233.08 466.16 932.33 1864.66 2 B 61.74 123.47 246.94 493.88 987.77 1975.53 3 C 65.41 130.81 261.63 523.25 1046.50 2093.01 4 C# 69.30 138.59 277.18 554.37 1108.73 2217.46 5 D 73.42 146.83 293.67 587.33 1174.66 2349.32 6 D# 77.78 155.56 311.13 622.25 1244.51 2489.02 7 E 82.41 164.81 329.63 659.26 1318.51 2637.02 8 F 87.31 174.61 349.23 698.46 1396.91 2793.83 9 F# 92.50 185.00 369.99 739.99 1479.98 2959.95 10 G 98.00 196.00 391.99 783.99 1567.98 3135.96 11 G# 103.83 207.65 415.31 830.61 1661.22 3322.44 12 A 110.00 220.00 440.00 880.00 1760.00 3520.00 Entries are frequencies. Each column is an octave. Magic factor = 2^(1/12). C3 = 261.63, A4 = 440.00
“Adding” Sinusoids Middle C: + = A above middle C:
“Adding” Sinusoids averaging the sine values Fs = 32768;tFinal = 1; t = 0:(1/Fs):tFinal; C3 = 261.62; yC3 = sin(2*pi*C3*t); A4 = 440.00; yA4 = sin(2*pi*A4*t); y = (yC3 + yA4)/2; sound(y,Fs)
Application: touchtone telephones Make a signal by combining two sinusoids
A frequency is associated with each row & column. So two frequencies are associated with each button. The “5”-Button corresponds to (770,1336) 697 770 852 Each button has its own 2-frequency “fingerprint”! 941 1209 1336 1477
Signal for button 5: Fs = 32768; tFinal = .25; t = 0:(1/Fs):tFinal; yR = sin(2*pi*770*t); yC = sin(2*pi*1336*t) y = (yR + yC)/2; sound(y,Fs) MakeShowPlay.m
This is the “fingerprint” of button ‘5’
To Minimize Ambiguity… • No frequency is a multiple of another • The difference between any two frequencies does not equal any of the frequencies • The sum of any two frequencies does not equal any of the frequencies Why is this important? I dial a number (send signal). The receiver of the signals get a “noisy” version of the real signal. How will the noisy data be interpreted? SendNoisy.m
How to compare two signals (vectors)? Given two vectors x and y of the same length, the cosine of the angle between the two vectors is a measure of the correlation between vectors x and y: Small cosine low correlation High cosine highly correlated cos_xy.m ShowCosines.m
Sending and deciphering noisy signals • Randomly choose a button • Choose random row and column numbers • Construct the real signal (MakeShowPlay) • Add noise to the signal (SendNoisy) • Compute cosines to decipher the signals (ShowCosines) • SeeEg13_2
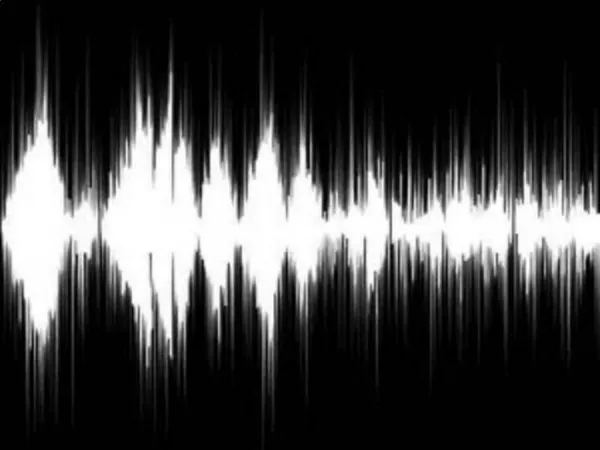
What does the signal look like for a multi-digit call? “Perfect” signal Each band matches one of the twelve “fingerprints” Buttons pushed at equal time intervals
“Noisy” signal One of the most difficult problems is how to segment the multi-button signal! Each band approximately matches one of the twelve “fingerprints.” There is noise between the button pushes. Buttons pushed at unequal time intervals