Understanding Image Filtering: Median vs. Mean in Edge Detection
520 likes | 614 Vues
Discover the significance of median and mean filtering in image processing for edge detection, utilizing arrays and precise gray value computations. Learn the techniques to spot and enhance image edges effectively.

Understanding Image Filtering: Median vs. Mean in Edge Detection
E N D
Presentation Transcript
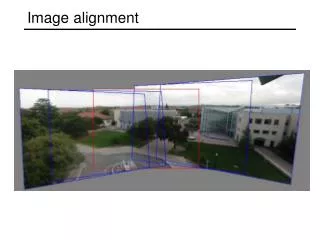
23. Working with Image Files Cont’d Filtering Noise Edge Detection
Pictures as Arrays A black and white picture can be encoded as a 2D Array Typical: 0 <= A(i,j) <= 255 (black) (white) Values in between correspond to different levels of grayness.
Just a Bunch of Numbers 1458-by-2084 150 149 152 153 152 155 151 150 153 154 153 156 153 151 155 156 155 158 154 153 156 157 156 159 156 154 158 159 158 161 157 156 159 160 159 162
Dirt! 1458-by-2084 150 149 152 153 152 155 151 150 153 154 153 156 153 2 3 156 155 158 154 2 1 157 156 159 156 154 158 159 158 161 157 156 159 160 159 162 Note how the “dirty pixels” look out of place
Idea 1458-by-2084 150 149 152 153 152 155 151 150 153 154 153 156 153 ? ? 156 155 158 154 ? ? 157 156 159 156 154 158 159 158 161 157 156 159 160 159 162 Assign “typical” neighborhood gray values to “dirty pixels”
Getting Precise “Typical neighborhood gray values” Could use Median Or Mean radius 1 radius 3 We’ll look at “Median Filtering” first…
Median Filtering Visit each pixel. Replace its gray value by the median of the gray values in the “neighborhood”.
7 7 7 7 6 6 7 7 0 6 7 7 6 6 6 6 6 6 Using a radius 1 “Neighborhood” 0 6 6 6 6 7 7 7 7 Before After
How to Visit Every Pixel m = 9 n = 18 for i=1:m for j=1:n Compute new gray value for pixel (i,j). end end
Original: i = 1 j = 1 Filtered: Replace with the median of the values under the window.
Original: i = 1 j = 2 Filtered: Replace with the median of the values under the window.
Original: i = 1 j = 3 Filtered: Replace with the median of the values under the window.
Original: i = 1 j = n Filtered: Replace with the median of the values under the window.
Original: i = 2 j = 1 Filtered: Replace with the median of the values under the window.
Original: i = 2 j = 2 Filtered: Replace with the median of the values under the window.
Original: i = m j = n Filtered: Replace with the median of the values under the window.
What We Need… (1) A function that computes the median value in a 2-dimensional array C: m = medVal(C) (2) A function that builds the filtered image by using median values of radius r neighborhoods: B = medFilter(A,r)
21 89 36 28 19 88 43 19 21 28 36 43 88 89 Computing Medians x : x = sort(x) x : n = length(x); % n = 7 m = ceil(n/2); % m = 4 med = x(m); % med = 36 If n is even, then use : med = ( x(m) + x(m+1) )/2
Median of a 2D Array function med = medVal(C) [p,q] = size(C); x = []; for k=1:p x = [x C(k,:)]; end Compute median of x and assign to med.
Medians vs Means A = 150 151 158 159 156 153 151 156 155 151 150 155 152 154 159 156 154 152 158 152 152 158 157 150 157 Median = 154 Mean = 154.2
Medians vs Means A = 150 151 158 159 156 153 151 156 155 151 150 155 0 154 159 156 154 152 158 152 152 158 157 150 157 Median = 154 Mean = 148.2
Back to Filtering… m = 9 n = 18 for i=1:m for j=1:n Compute new gray value for pixel (i,j). end end
Window Inside… m = 9 n = 18 New gray value for pixel (7,4) = medVal( A(6:8,3:5) )
Window Partly Outside… m = 9 n = 18 New gray value for pixel (7,1) = medVal( A(6:8,1:2) )
Window Partly Outside… m = 9 n = 18 New gray value for pixel (9,18) = medVal( A(8:9,17:18) )
function B = medFilter(A,r) % B from A via median filtering % with radius r neighborhoods. [m,n] = size(A); B = uint8(zeros(m,n)); for i=1:m for j=1:n C = pixel (i,j) neighborhood B(i,j) = medVal(C); end end
The Pixel (i,j) Neighborhood iMin = max(1,i-r) iMax = min(m,i+r) jMin = max(1,j-r) jMax = min(n,j+r) C = A(iMin:iMax,jMin:jMax) m A r = 1 r = 2 n
What About Using the Meaninstead of the Median? Replace each gray value with the average gray value in the radius r neighborhood.
Why it Fails 150 149 152 153 152 155 151 150 153 154 153 156 153 2 3 156 155 158 154 2 1 157 156 159 156 154 158 159 158 161 157 156 159 160 159 162 The mean does not capture representative values. 85 86 87 88
And Median Filters LeaveEdges (Pretty Much) Alone 200 200 200 200 200 200 200 200 200 200 200 100 200 200 200 200 100 100 200 200 200 100 100 100 200 200 100 100 100 100 200 100 100 100 100 100 Inside the box, the 200’s stay at 200 and the 100’s stay at 100.
What is an Edge? Near an edge, grayness values change abruptly 200 200 200 200 200 200 200 200 200 200 200 100 200 200 200 200 100 100 200 200 200 100 100 100 200 200 100 100 100 100 200 100 100 100 100 100
General plan for showing the edges in in image • Identify the “edge pixels” • Highlight the edge pixels • make edge pixels white; make everything else black 200 200 200 200 200 200 200 200 200 200 200 100 200 200 200 200 100 100 200 200 200 100 100 100 200 200 100 100 100 100 200 100 100 100 100 100
General plan for showing the edges in in image • Identify the “edge pixels” • Highlight the edge pixels • make edge pixels white; make everything else black 200 200 200 200 200 200 200 200 200 200 200 100 200 200 200 200 100 100 200 200 200 100 100 100 200 200 100 100 100 100 200 100 100 100 100 100 BLACK W H I T E BLACK
The Rate-of-Change-Array Suppose A is an image array with integer values between 0 and 255 B(i,j) be the maximum difference between A(i,j) and any of its eight neighbors.
The Rate-of-Change-Array Suppose A is an image array with integer values between 0 and 255 Let B(i,j) be the maximum value in A(max(1,i-1):min(m,i+1),... max(1,j-1):min(n,j+1))- A(i,j) Neighborhood of A(i,j)
90 65 62 60 56 57 58 59 Rate-of-change example 81 Rate-of-change at middle pixel is 30 Be careful! In “uint8 arithmetic” 57 – 60 is 0
Built-in function to convert to grayscale. Returns 2-d array. function Edges(jpgIn,jpgOut,tau) % jpgOut is the “edge diagram” of image jpgIn. % At each pixel, if rate-of-change > tau % then the pixel is considered to be onanedge. A = rgb2gray(imread(jpgIn)); [m,n] = size(A); B = uint8(zeros(m,n)); for i = 1:m for j = 1:n B(i,j) = ????? end end
Recipe for rate-of-change B(i,j) % The 3-by-3 subarray that includes % A(i,j) and its 8 neighbors Neighbors = A(i-1:i+1,j-1:j+1); % Subtract A(i,j) from each entry Diff= abs(double(Neighbors)– ... double(A(i,j))); % Compute largest value in each column colMax = max(Diff); % Compute the max of the column max’s B(i,j) = max(colMax);
function Edges(jpgIn,jpgOut,tau) % jpgOut is the “edge diagram” of image jpgIn. % At each pixel, if rate-of-change > tau % then the pixel is considered to be onanedge. A = rgb2gray(imread(jpgIn)); [m,n] = size(A); B = uint8(zeros(m,n)); for i = 1:m for j = 1:n B(i,j) = ????? end end
function Edges(jpgIn,jpgOut,tau) % jpgOut is the “edge diagram” of image jpgIn. % At each pixel, if rate-of-change > tau % then the pixel is considered to be onanedge. A = rgb2gray(imread(jpgIn)); [m,n] = size(A); B = uint8(zeros(m,n)); for i = 1:m for j = 1:n Neighbors = A(max(1,i-1):min(i+1,m), ... max(1,j-1):min(j+1,n)); B(i,j)=max(max(abs(double(Neighbors)– ... double(A(i,j))))); end end
threshold “Edge pixels” are now identified; display them with maximum brightness (255) A 1 1 1 1 1 1 1 1 1 1 1 1 1 1 1 1 90 90 1 1 1 90 90 90 1 1 90 90 90 90 1 1 90 90 90 90 if B(i,j) > tau B(i,j) = 255; end B(i,j) 0 0 0 0 0 0 0 0 0 89 89 89 0 0 89 89 0 0 0 89 89 0 0 0 0 89 0 0 0 0 0 89 0 0 0 0 0 0 0 0 0 0 0 0 0 255 255 255 0 0 255 255 0 0 0 255 255 0 0 0 0 255 0 0 0 0 0 255 0 0 0 0
function Edges(jpgIn,jpgOut,tau) % jpgOut is the “edge diagram” of image jpgIn. % At each pixel, if rate-of-change > tau % then the pixel is considered to be on an edge. A = rgb2gray(imread(jpgIn)); [m,n] = size(A); B = uint8(zeros(m,n)); for i = 1:m for j = 1:n Neighbors = A(max(1,i-1):min(i+1,m), ... max(1,j-1):min(j+1,n)); B(i,j)=max(max(abs(double(Neighbors)– ... double(A(i,j))))); if B(i,j) > tau B(i,j) = 255; end end end
function Edges(jpgIn,jpgOut,tau) % jpgOut is the “edge diagram” of image jpgIn. % At each pixel, if rate-of-change > tau % then the pixel is considered to be on an edge. A = rgb2gray(imread(jpgIn)); [m,n] = size(A); B = uint8(zeros(m,n)); for i = 1:m for j = 1:n Neighbors = A(max(1,i-1):min(i+1,m), ... max(1,j-1):min(j+1,n)); B(i,j)=max(max(abs(double(Neighbors)– ... double(A(i,j))))); if B(i,j) > tau B(i,j) = 255; end end end imwrite(B,jpgOut,’jpg’)
Threshhold = 40